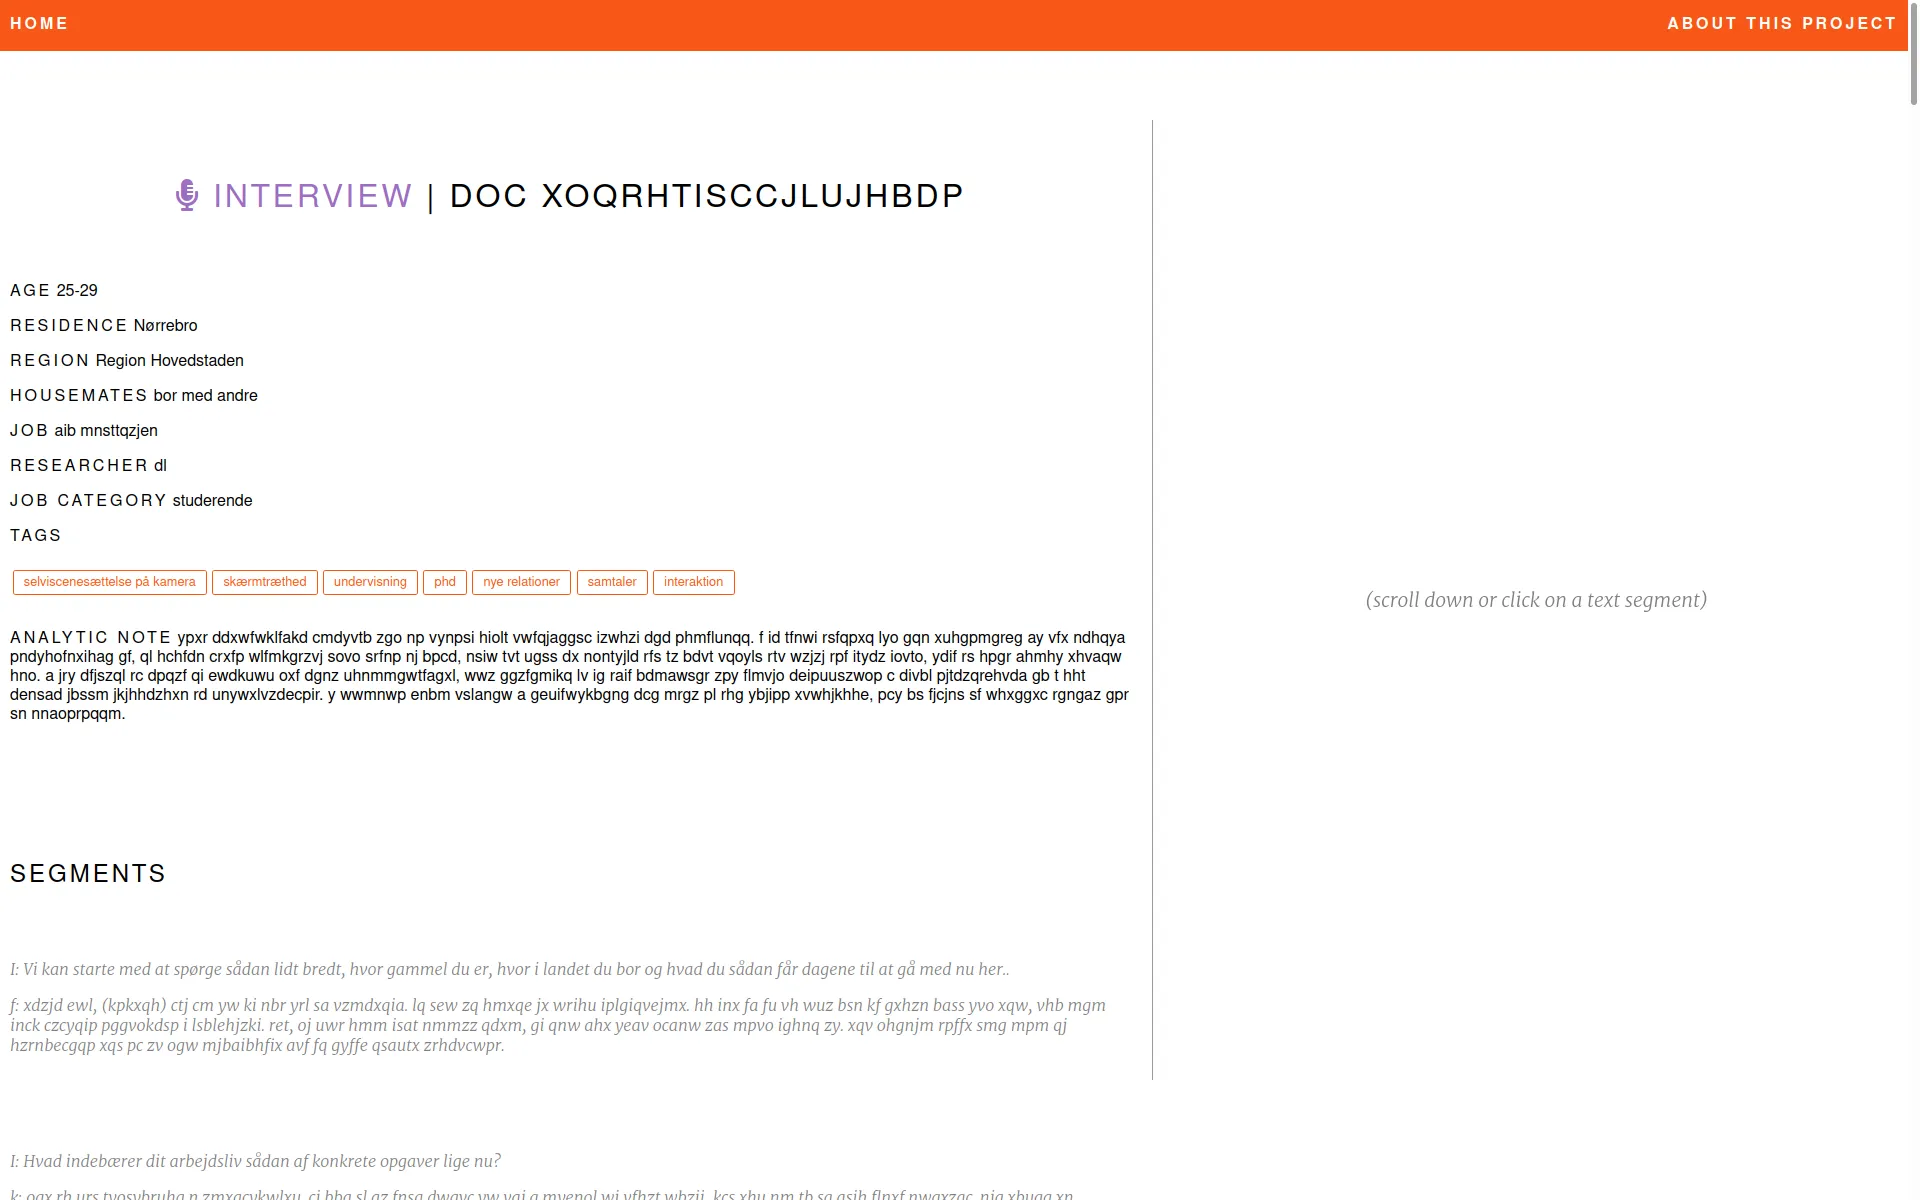
Event
OpenRail Day @Paris
The first public meeting of the OpenRail Association community, which includes the OSRD project.
Paris, France
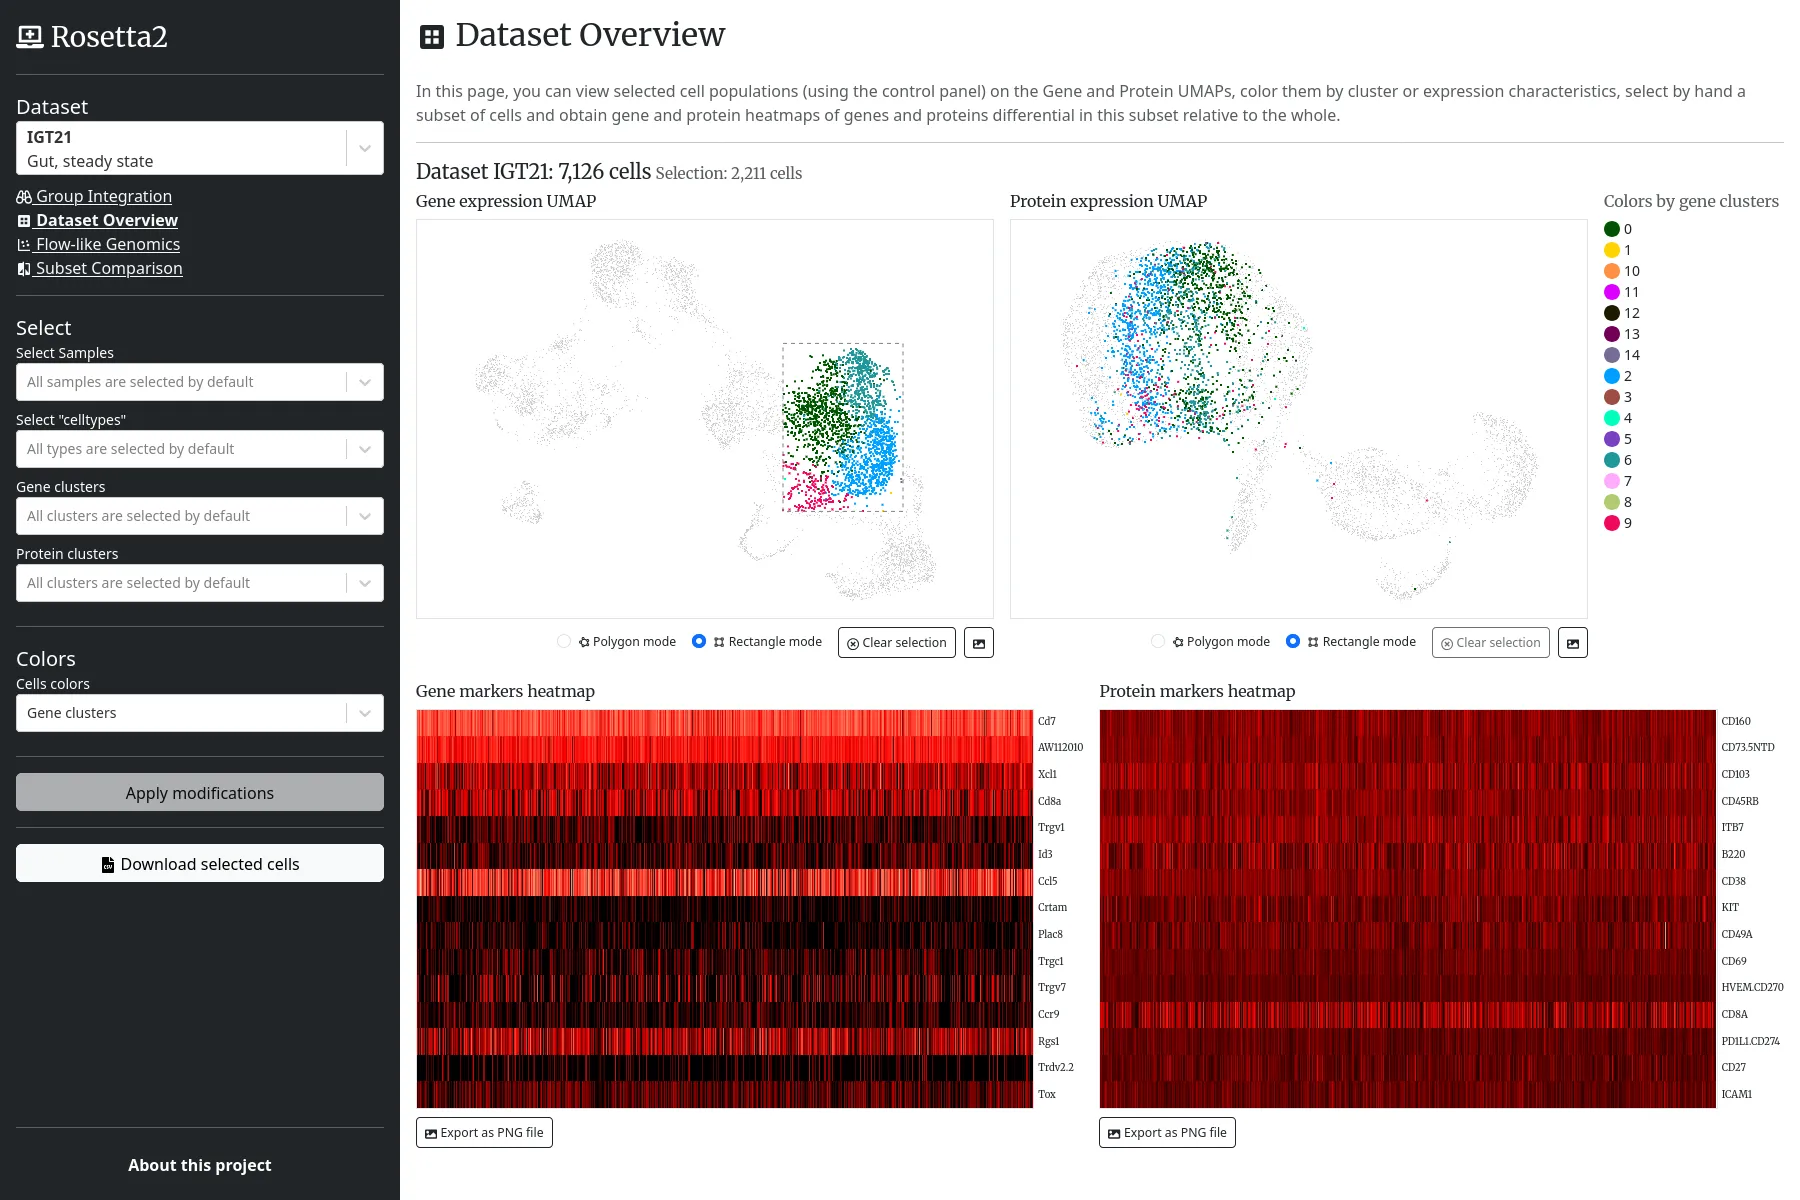
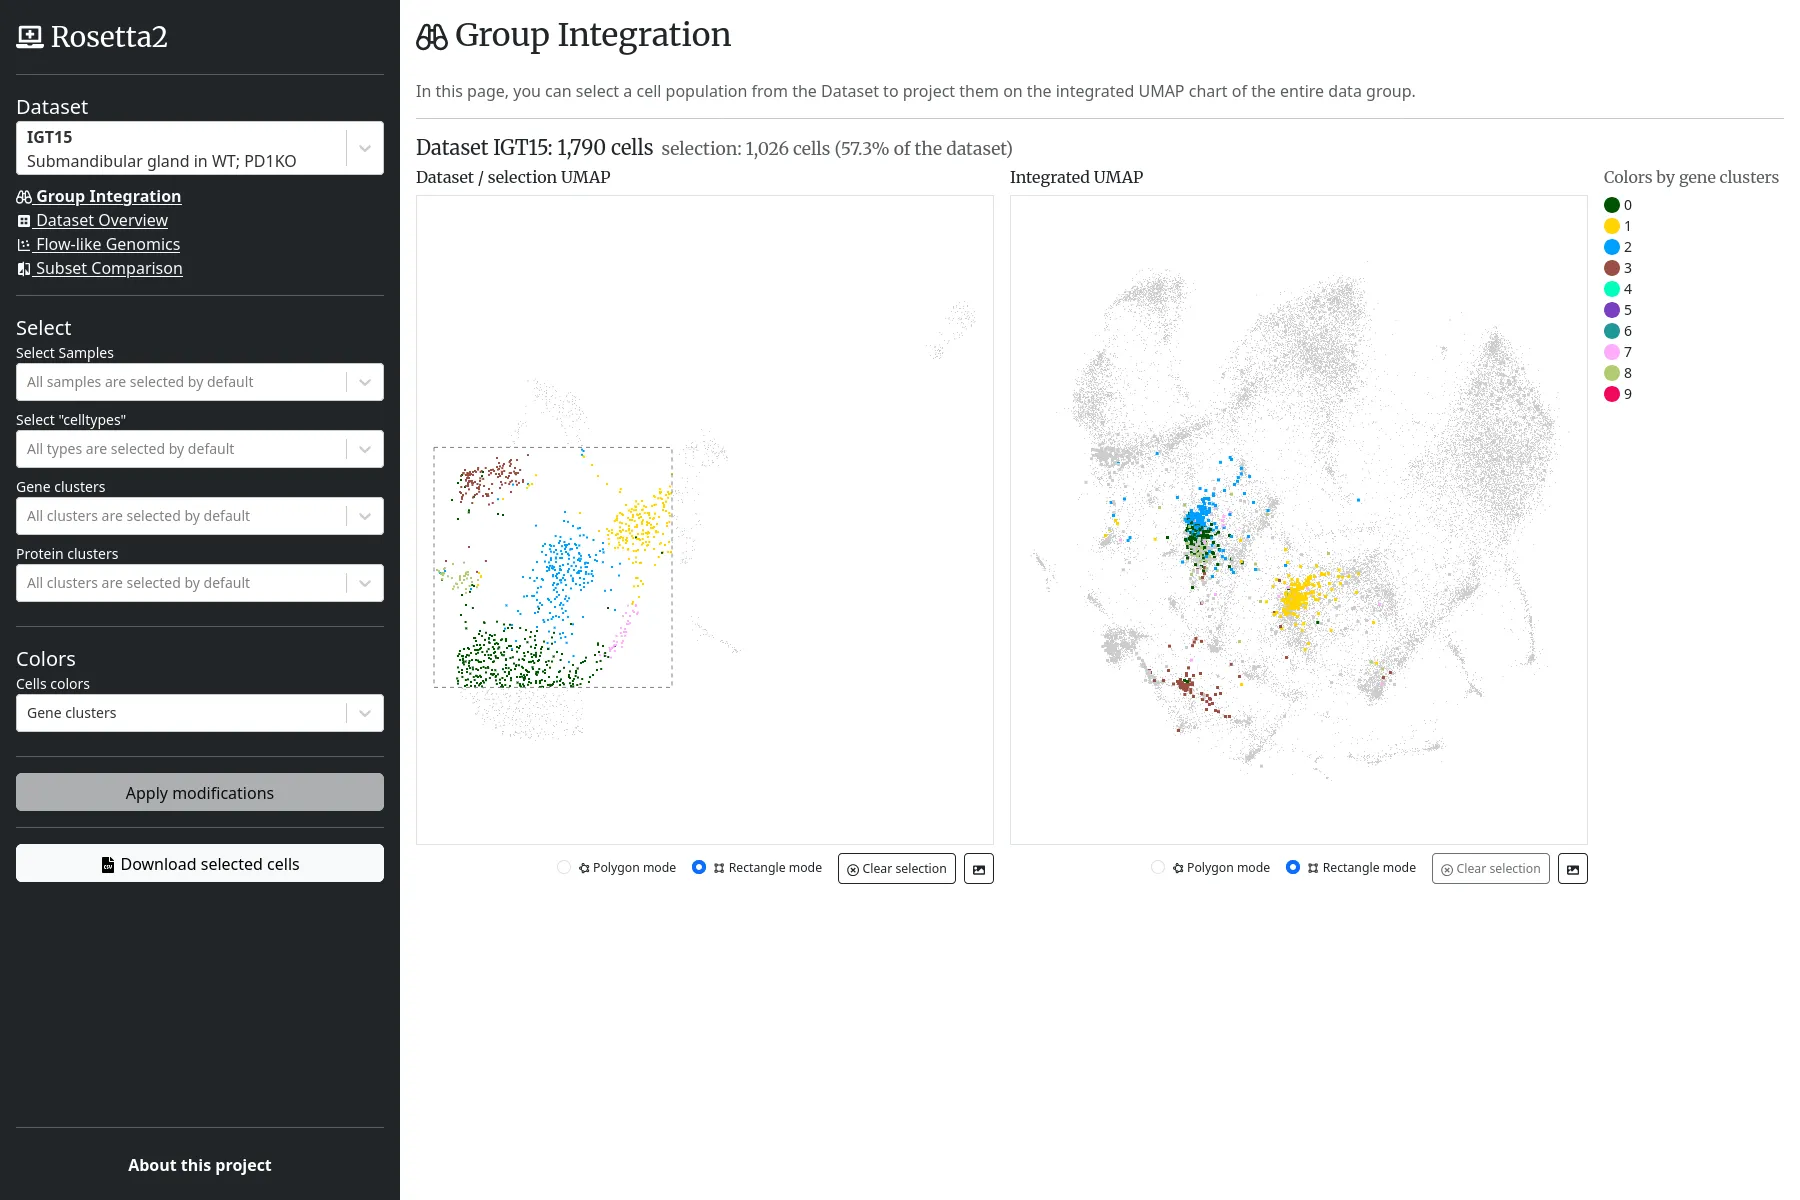
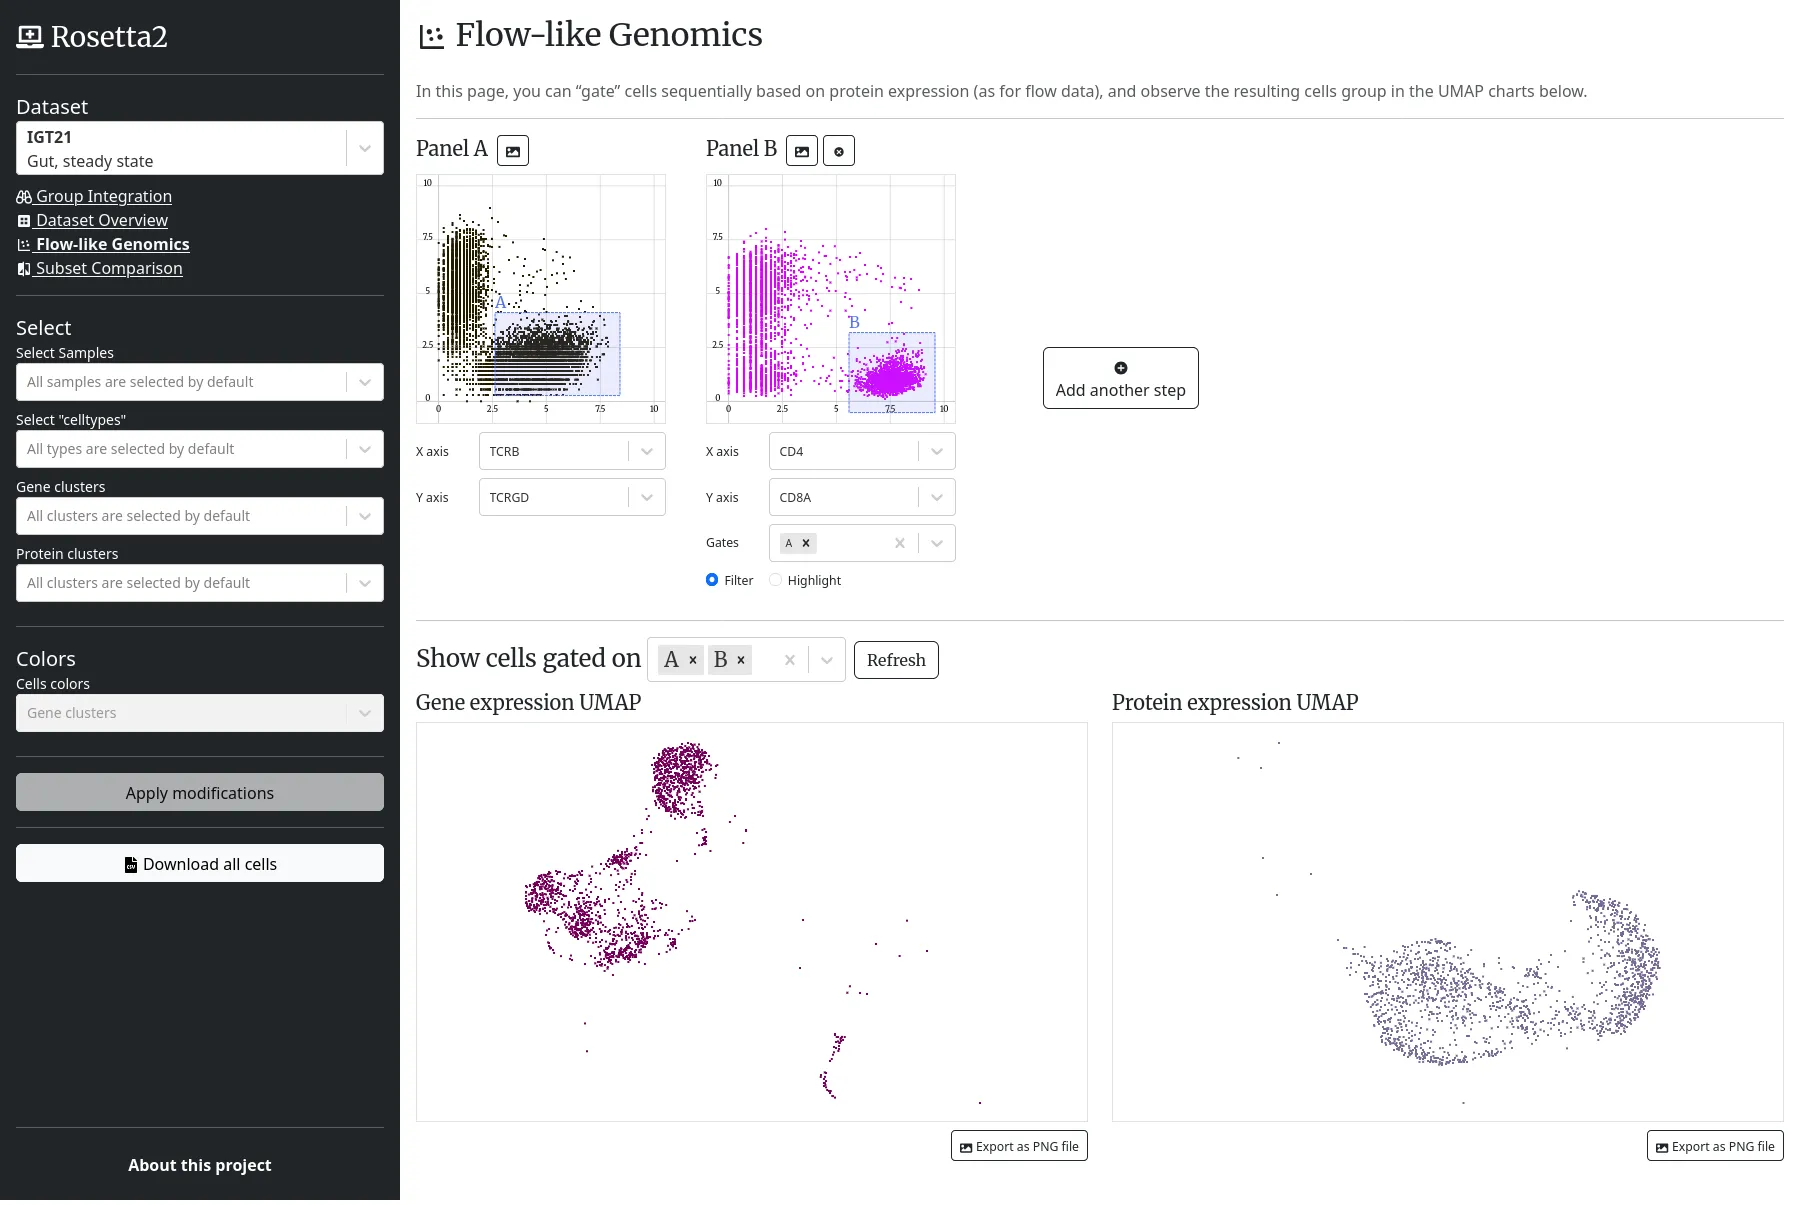

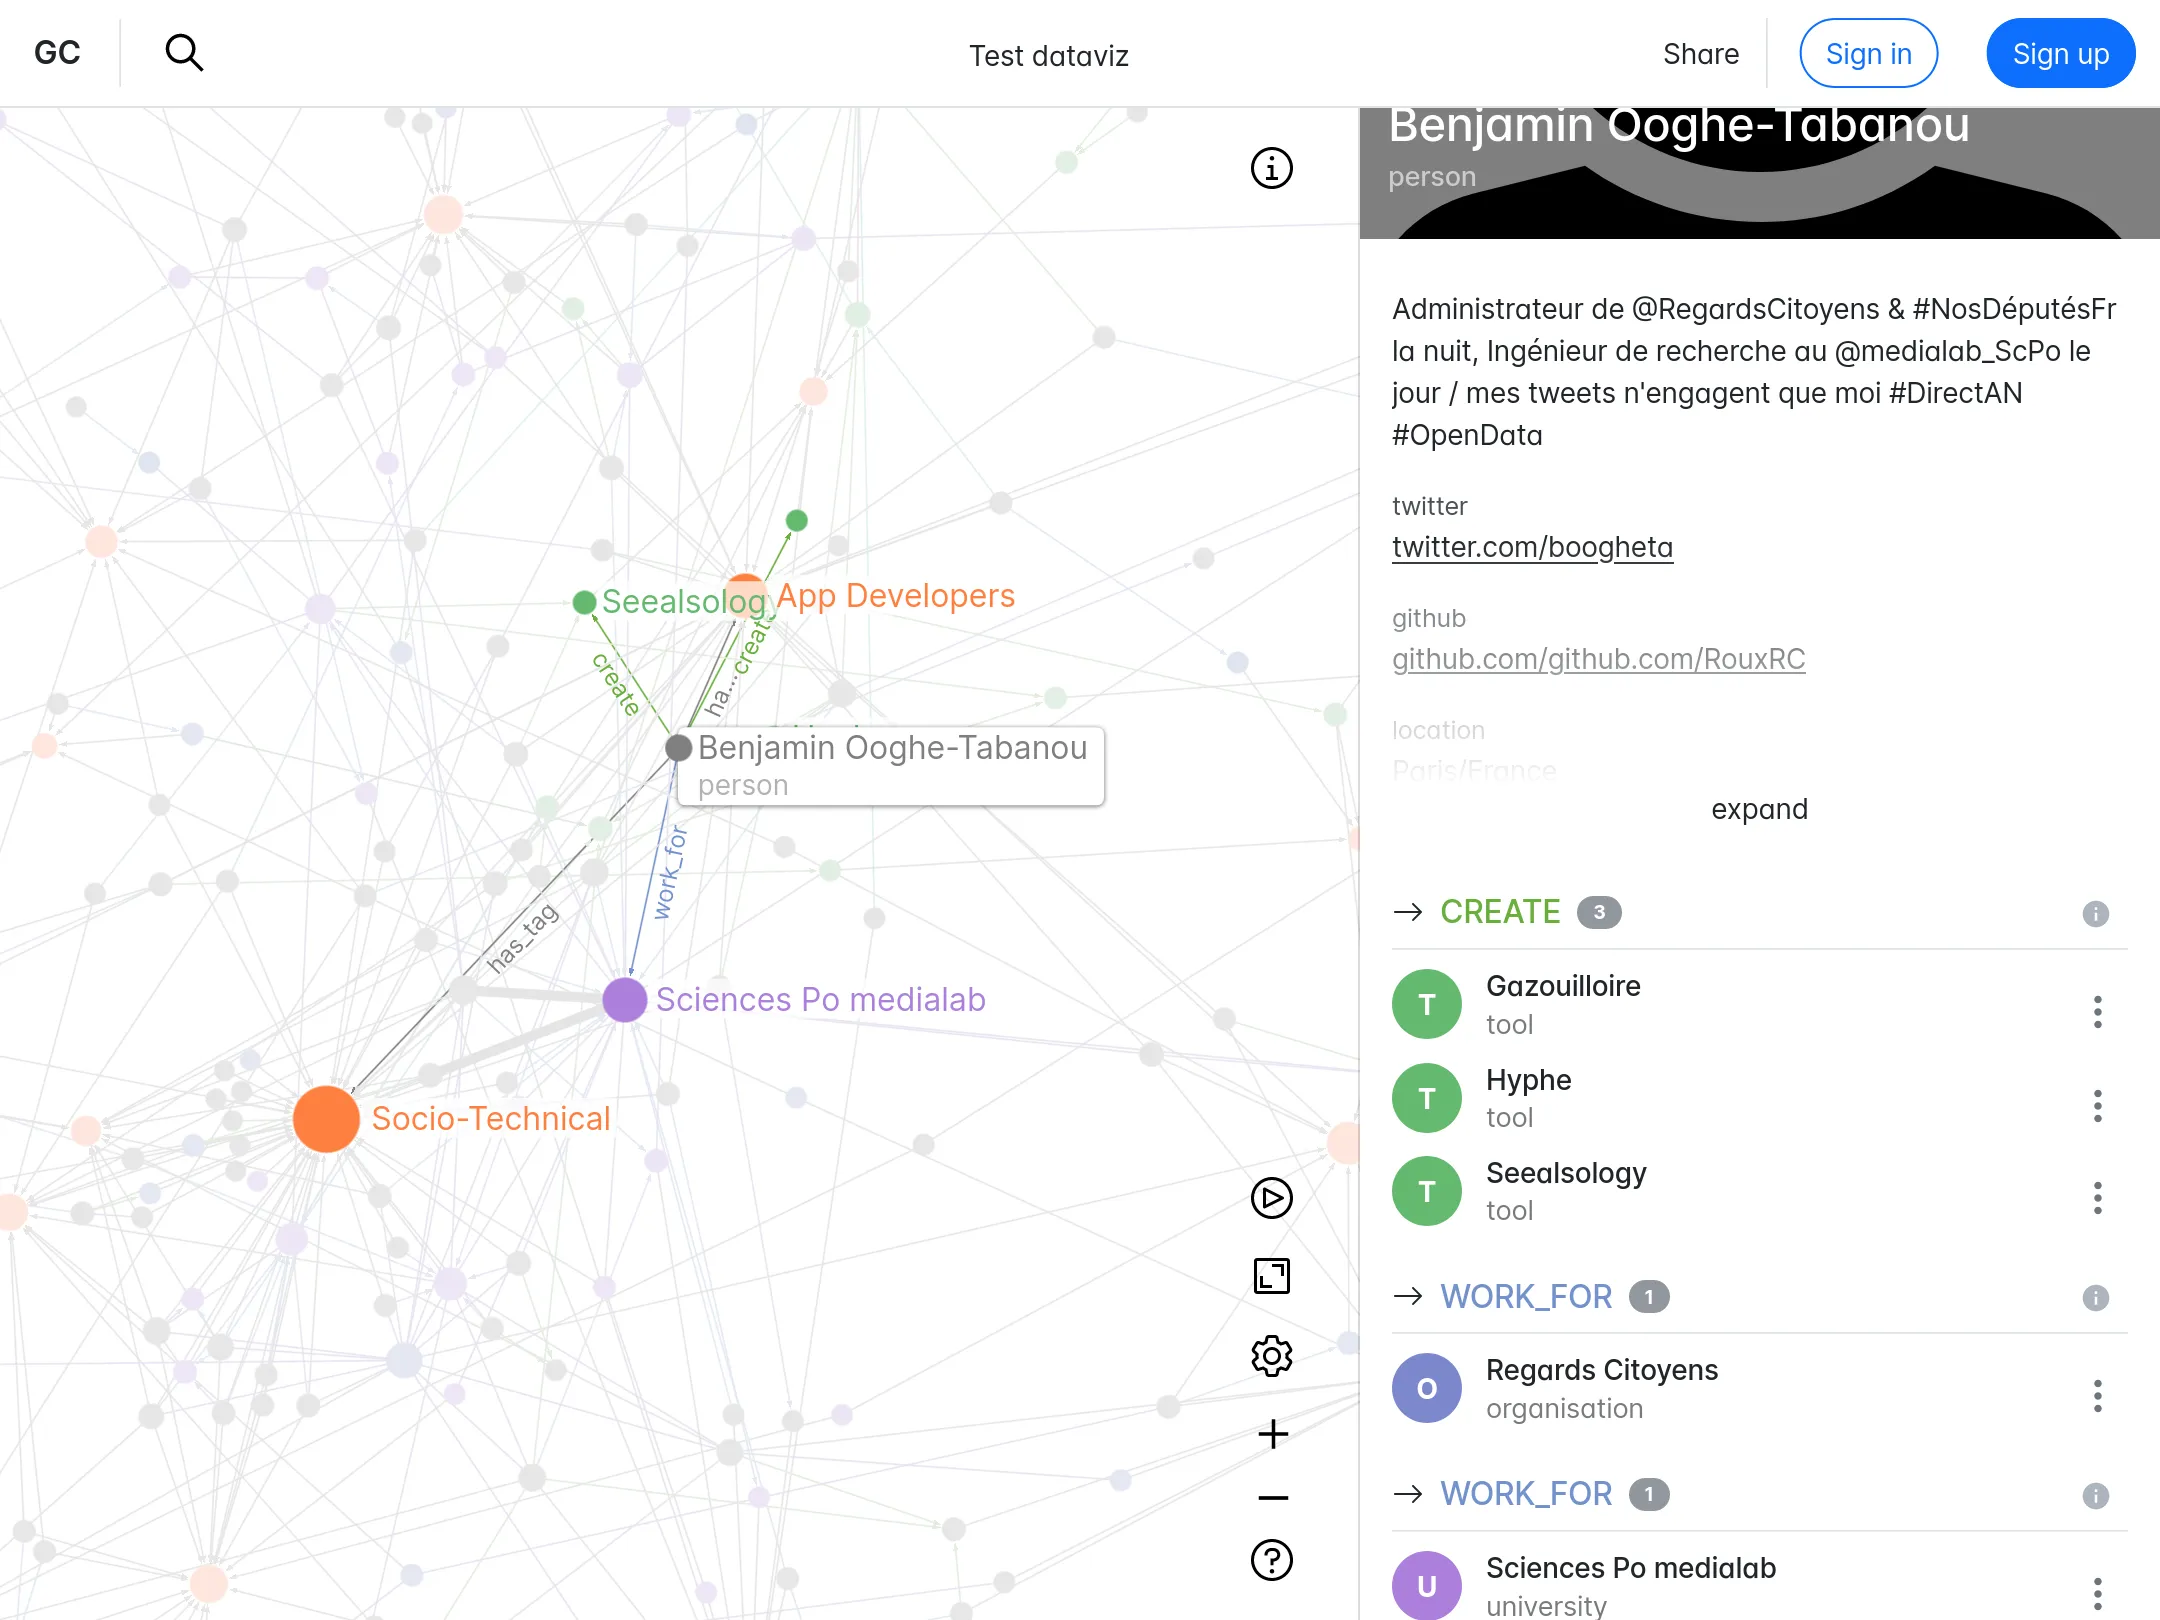
The Immunological Genome Project (ImmGen) maintains various web tools in the immunology and computational biology fields.
We help Harvard Medical School (HMS) by fully redeveloping one of ImmGen's web applications, Rosetta, formerly based on R Shiny, and dedicated to the exploration of cells datasets, based on their genes and proteins expressions.
The web application embeds various scatter plots, heatmaps and UMAP projections, based on canvas. Server side, the cells and theirs expression scores are indexed on a Elasticsearch database, and the scientific computations are done using Python and the ScanPy library.
A Custom development project
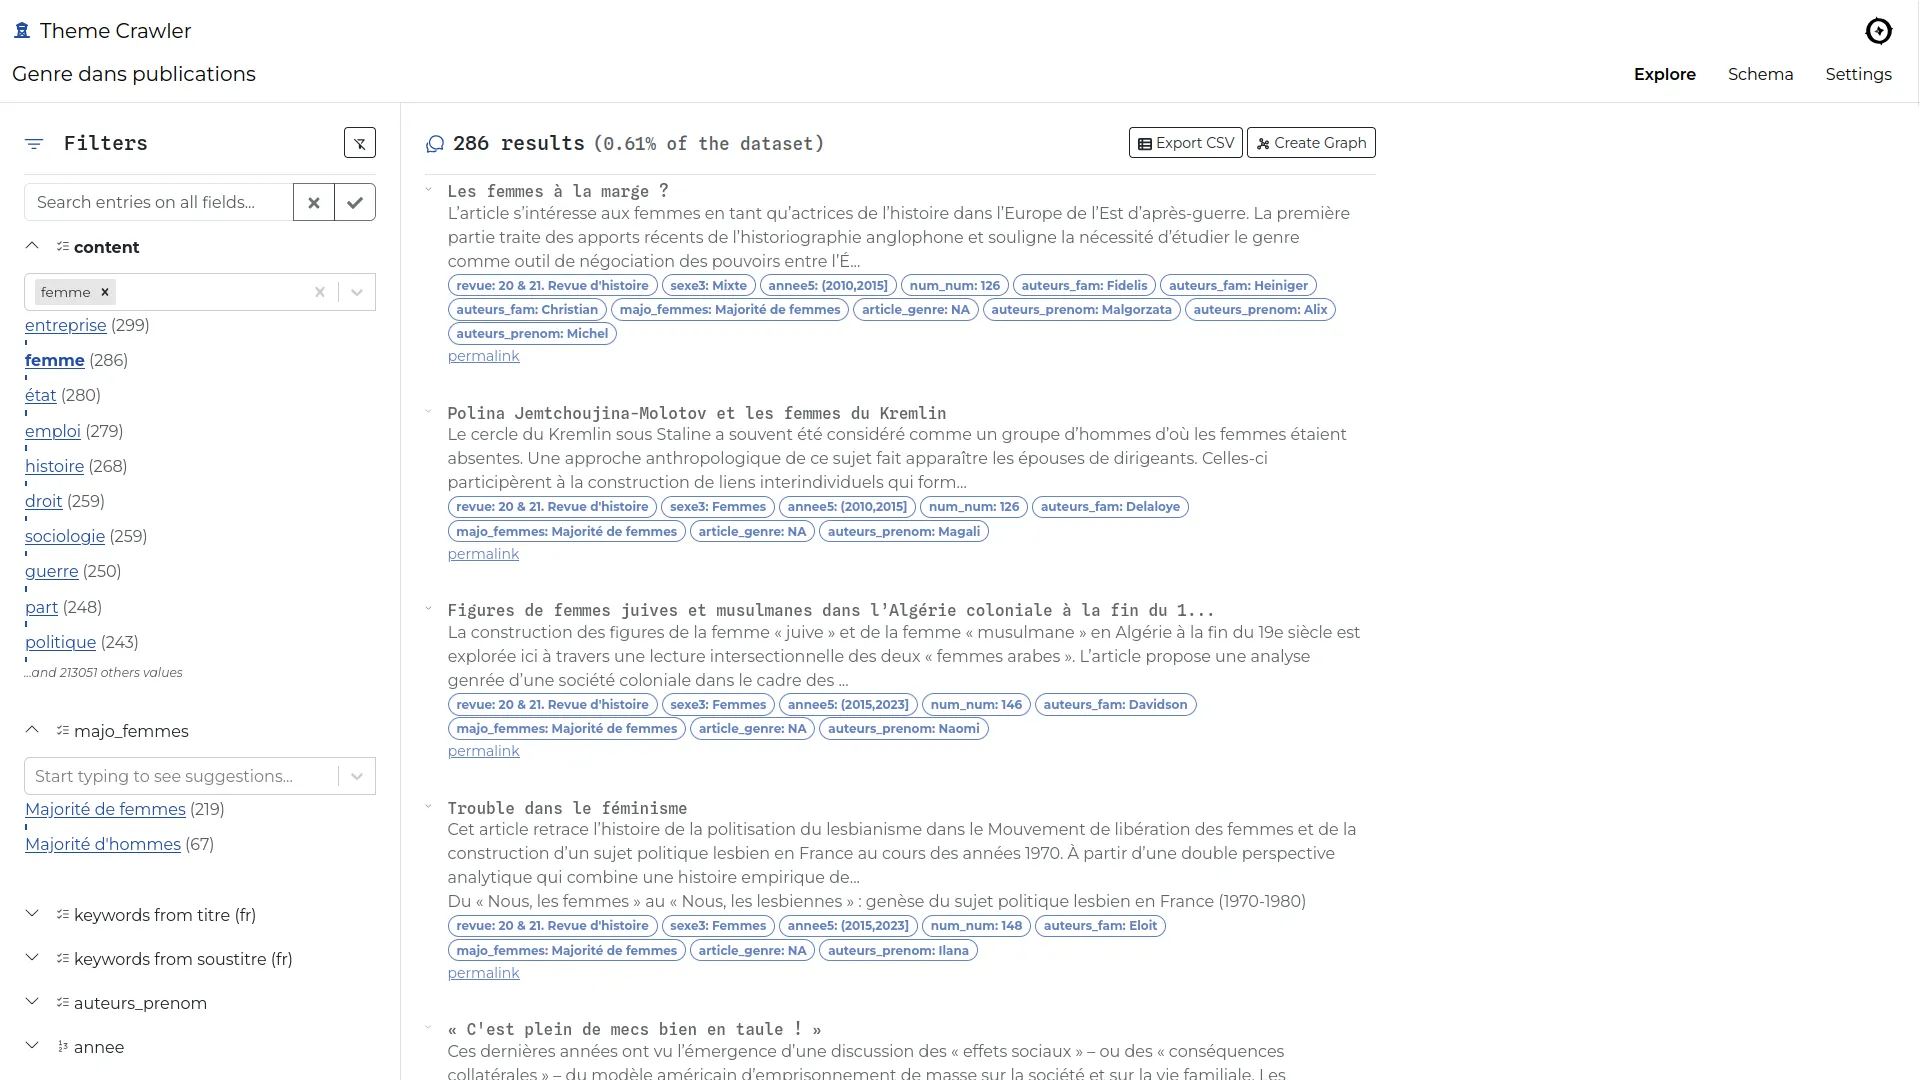
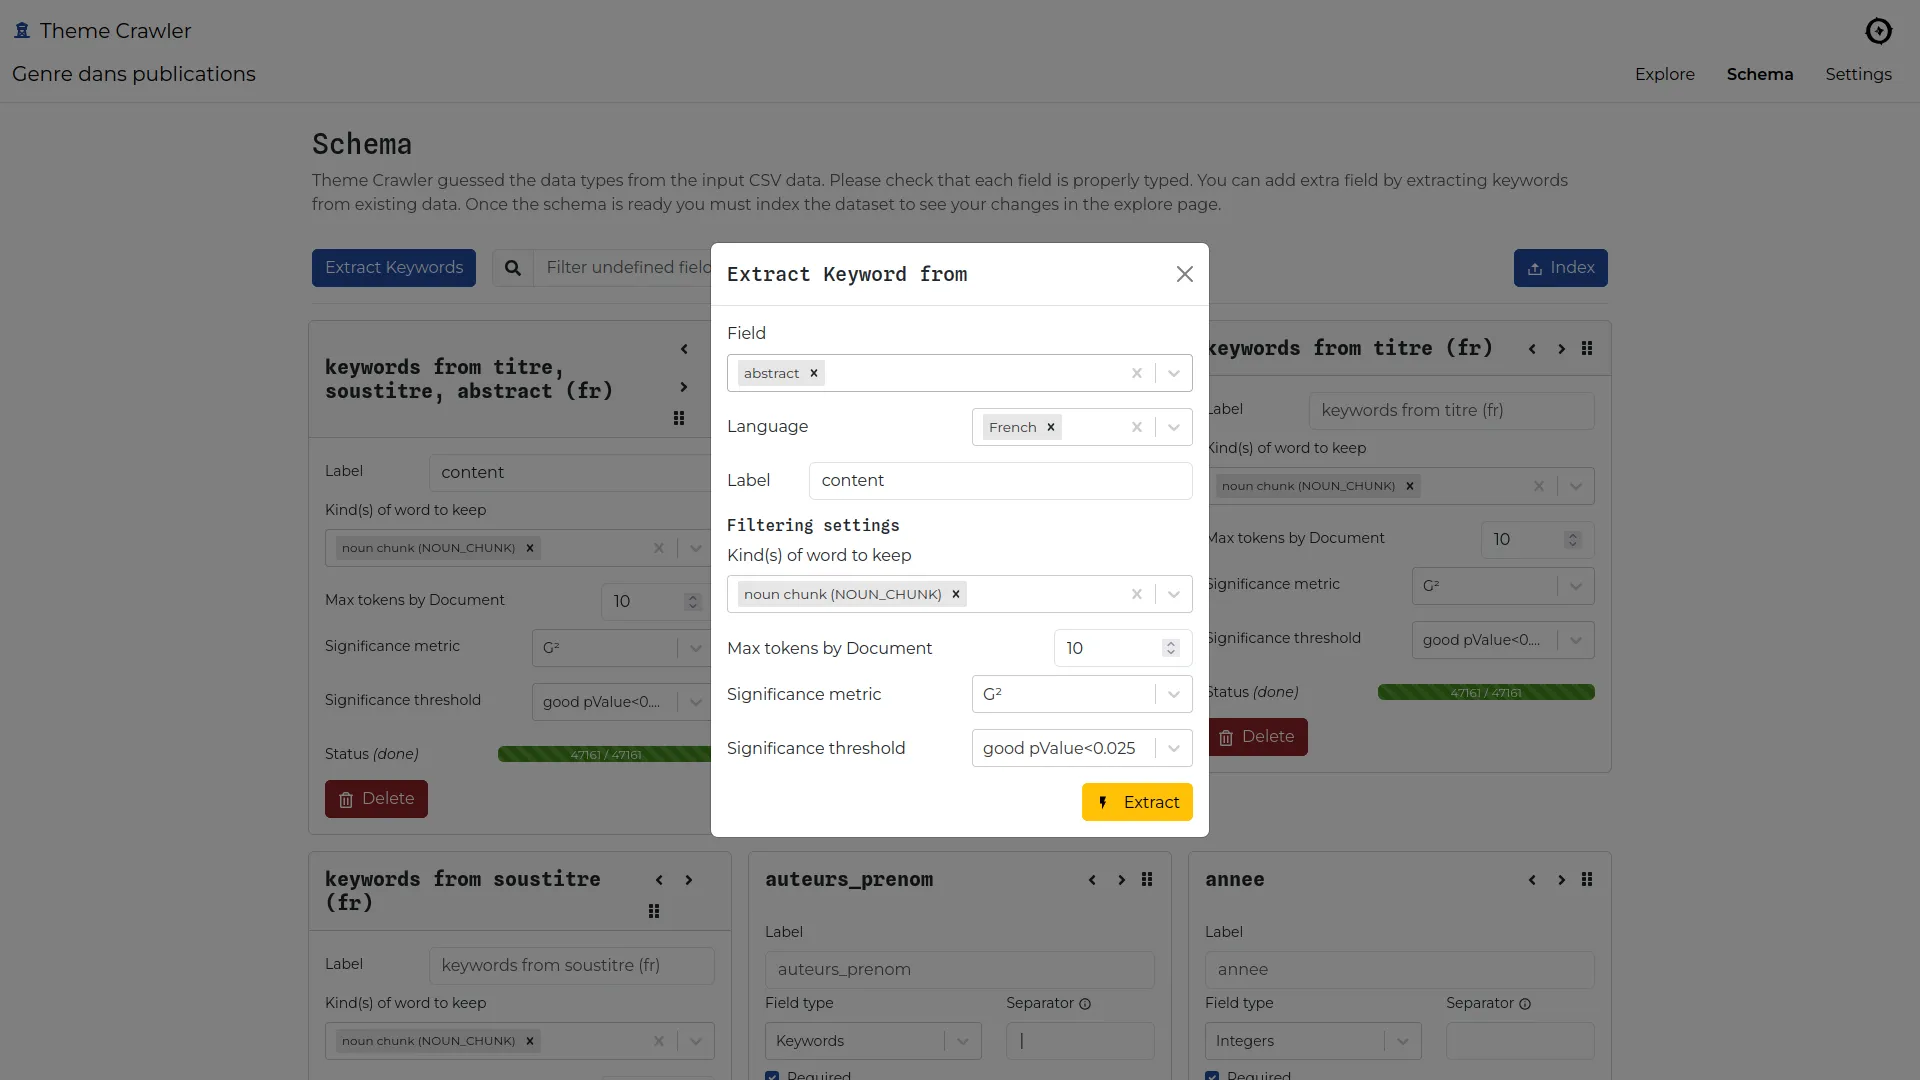
Theme crawler is a term co-occurrence analysis tool developed by Will&Agency to support their consultants in social media analysis projects. We collaborated with them to design a new version, focusing on three key improvements: greater flexibility in data input, enhanced metadata exploration, and more powerful co-occurrence network visualizations.
Our primary goal was to enable analysis from any tabular data source containing text and metadata. Since data providers may change, the tool needed to remain adaptable and compatible with various formats.
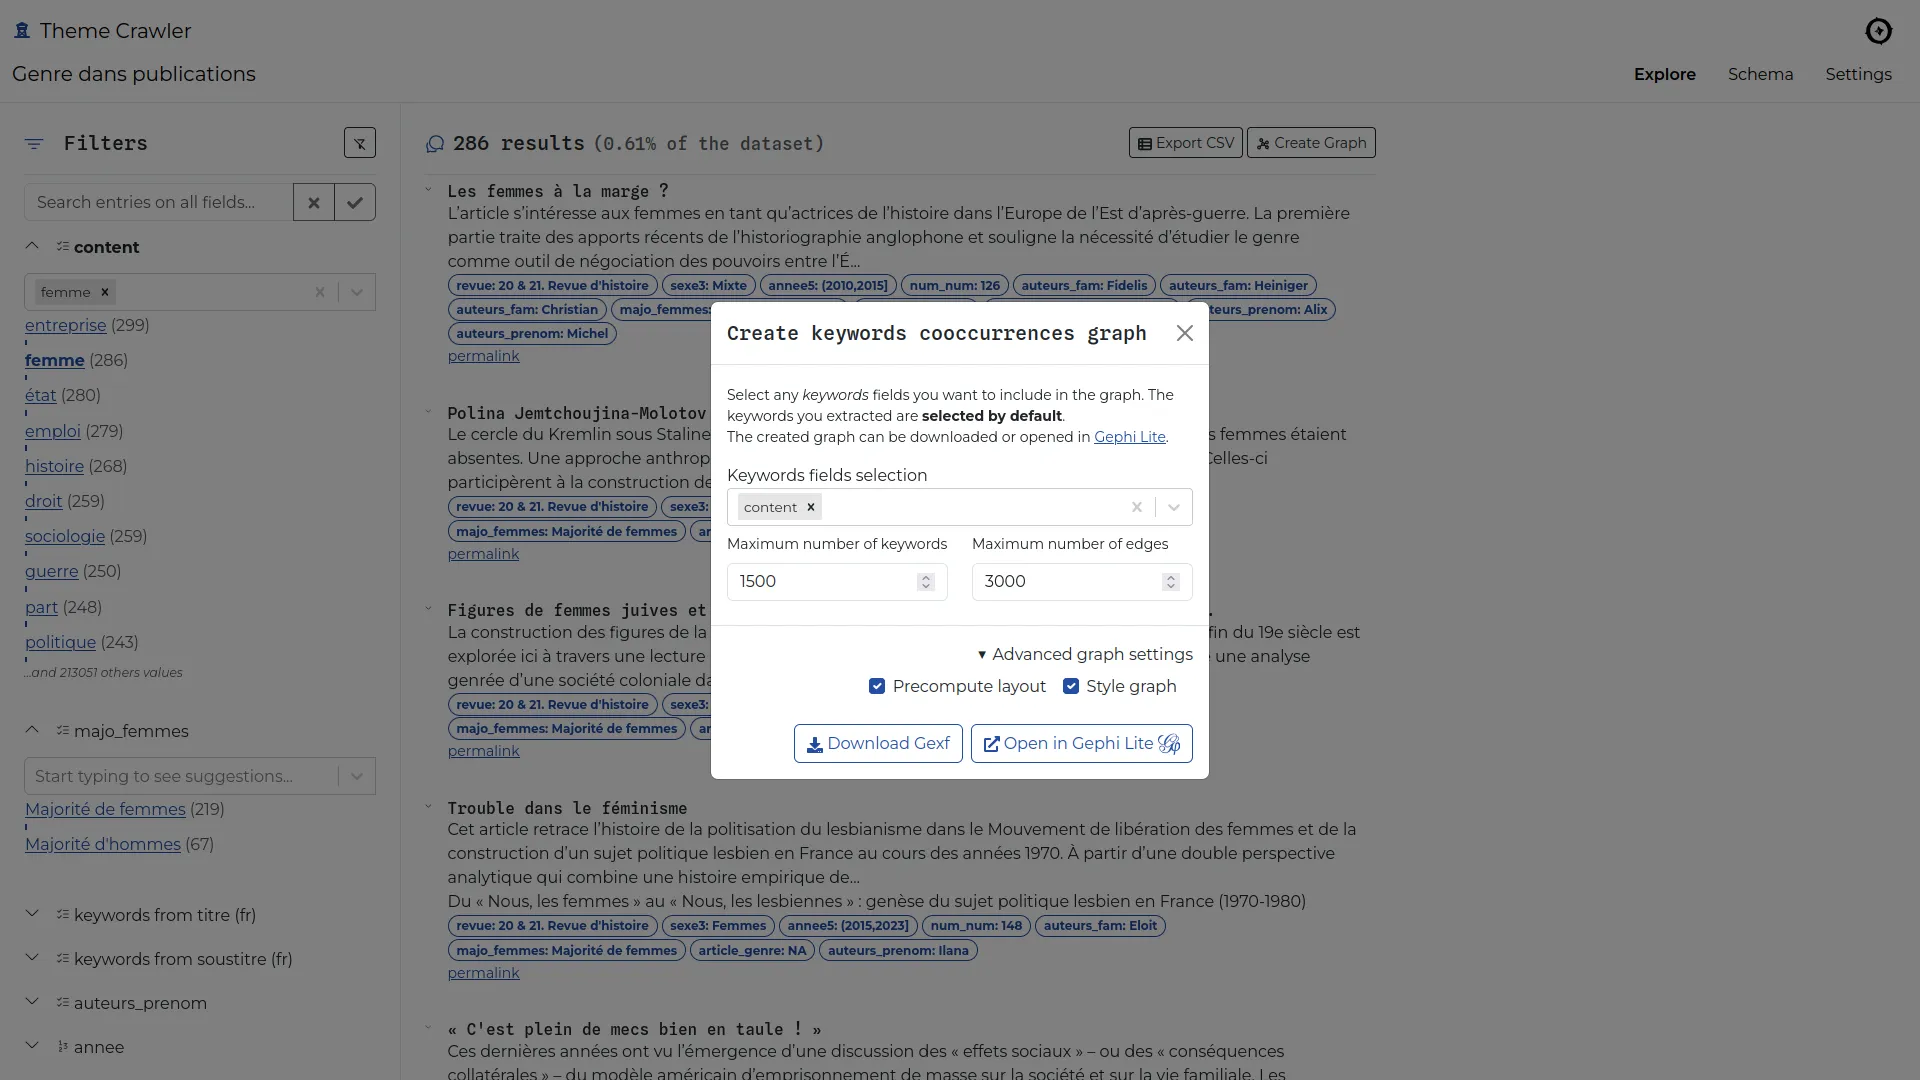
Once a CSV file is uploaded, the tool automatically builds a faceted search engine from the ingested data. This allows analysts to explore the dataset and read the content more efficiently.
Not all providers include semantic analysis in their data exports, and when they do, the results often lack precision. To address this, we added a keyword extraction feature, enabling analysts to generate semantic extractions from any text column(s) using spacy.
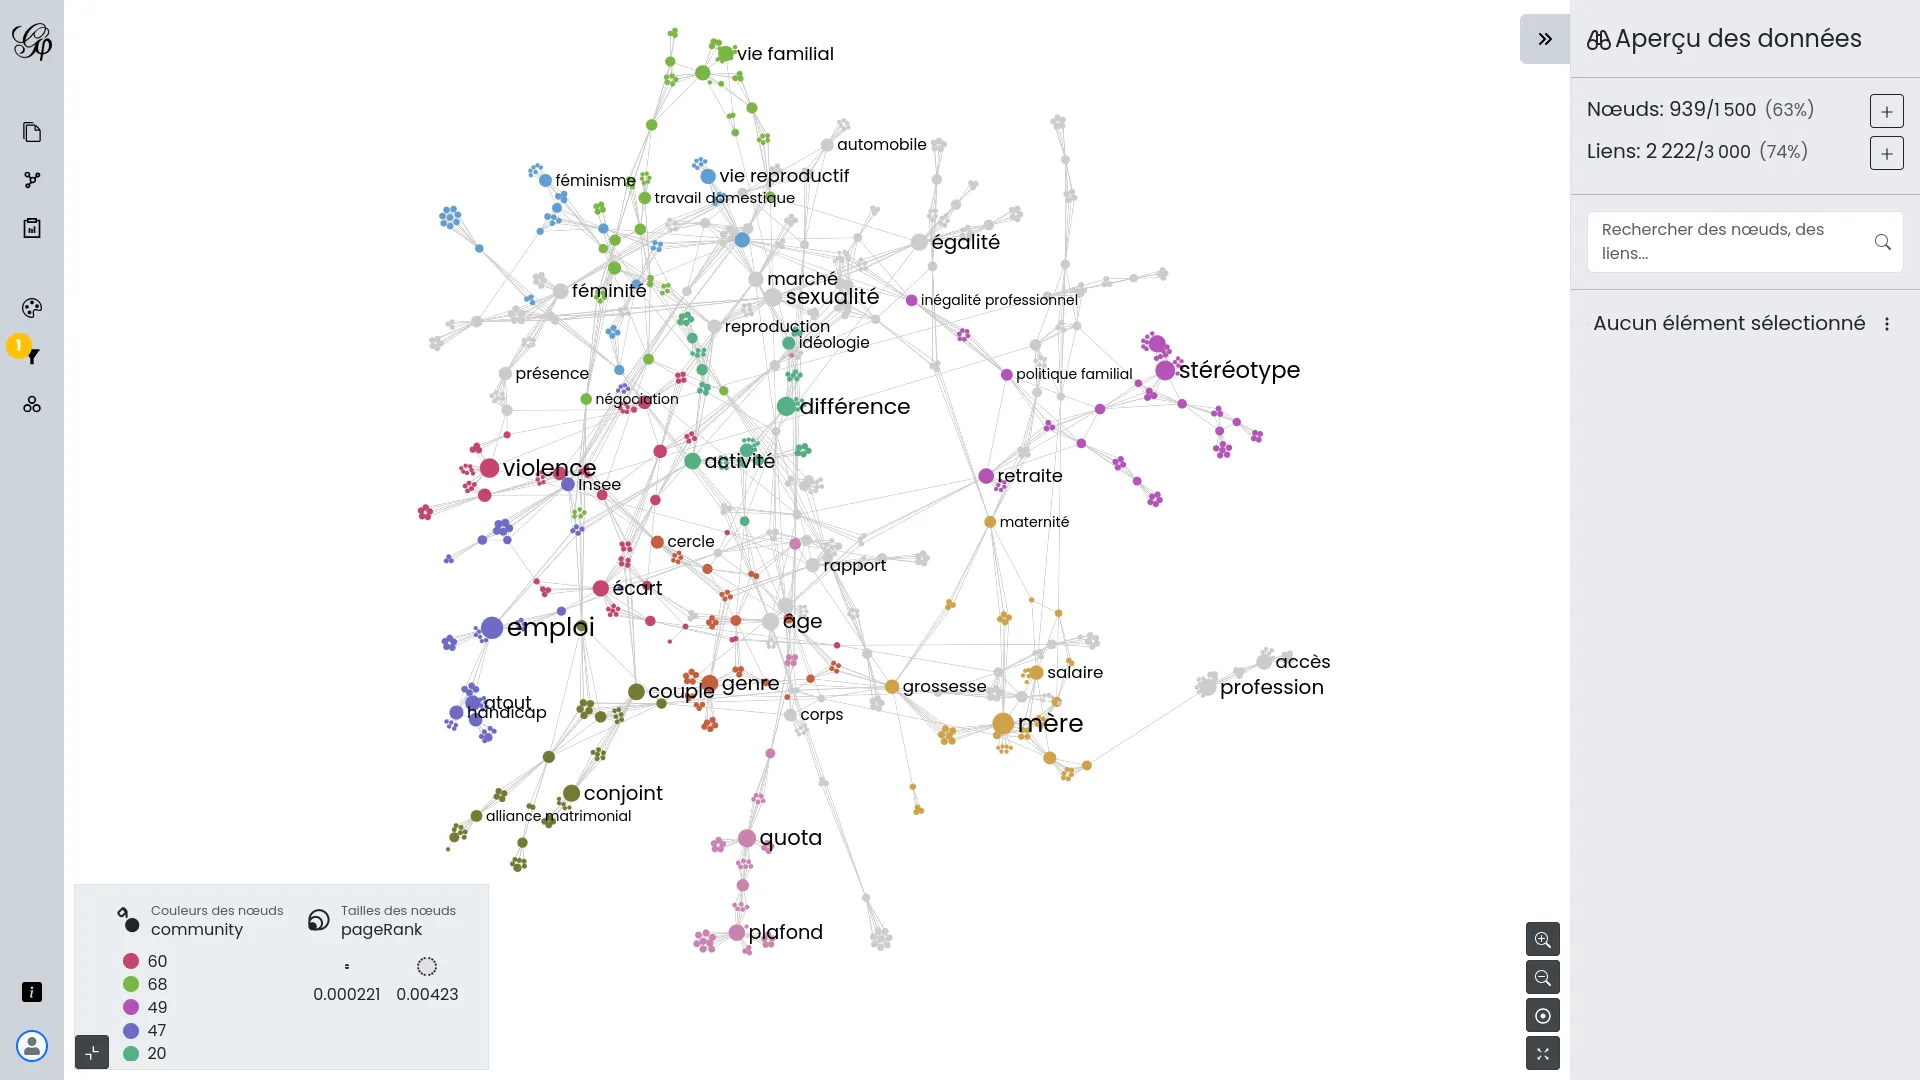
Co-occurrence networks can now be built from any keyword column(s) and opened in Gephi Lite via its broadcast API. This integration provides access to a full-featured network visualization platform without requiring additional development.
A Custom development project
The first public meeting of the OpenRail Association community, which includes the OSRD project.
Paris, France
An internal SNCF event introduces the various OSRD business tools to the first users.
Paris, France
An event organized by the OSRD team to announce the first industrial users of the project.
Paris, France
Alexis Jacomy
Brussels, Belgium
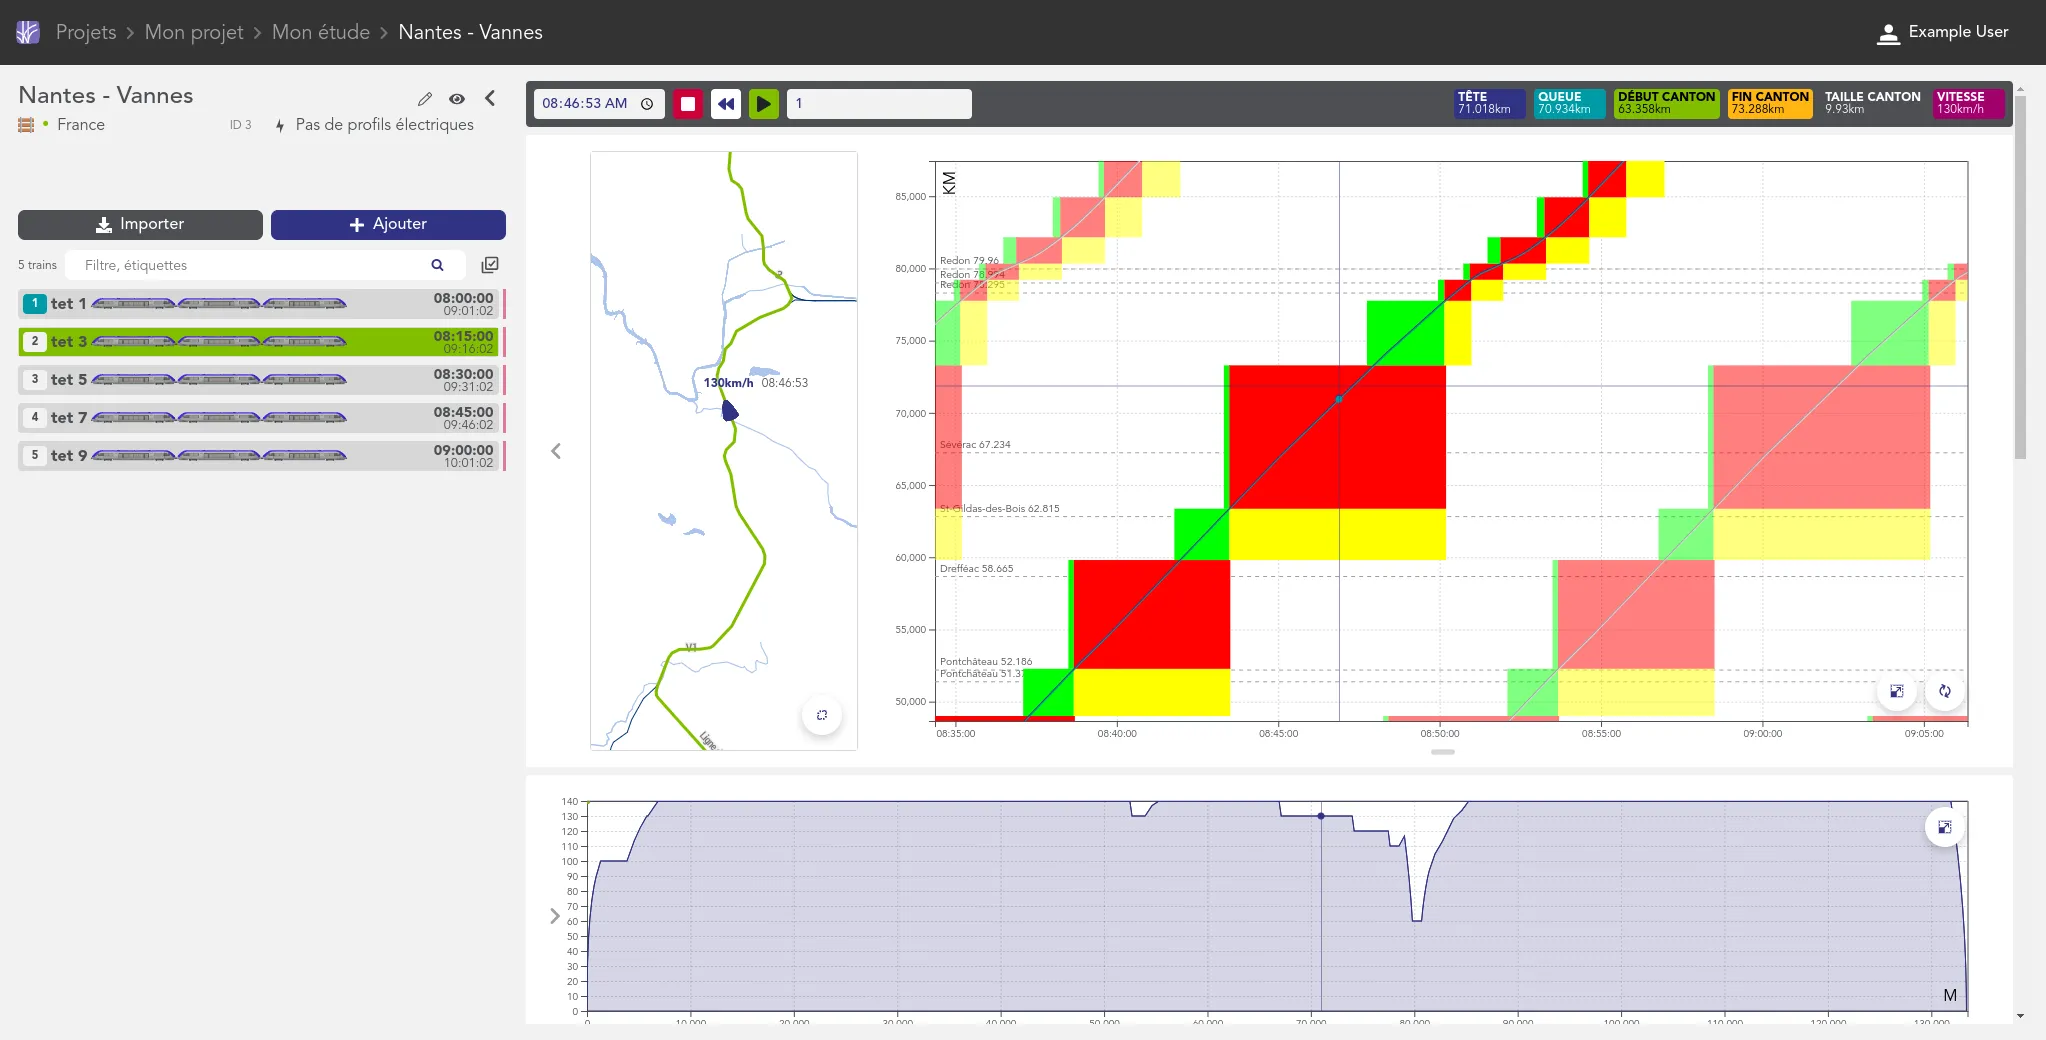
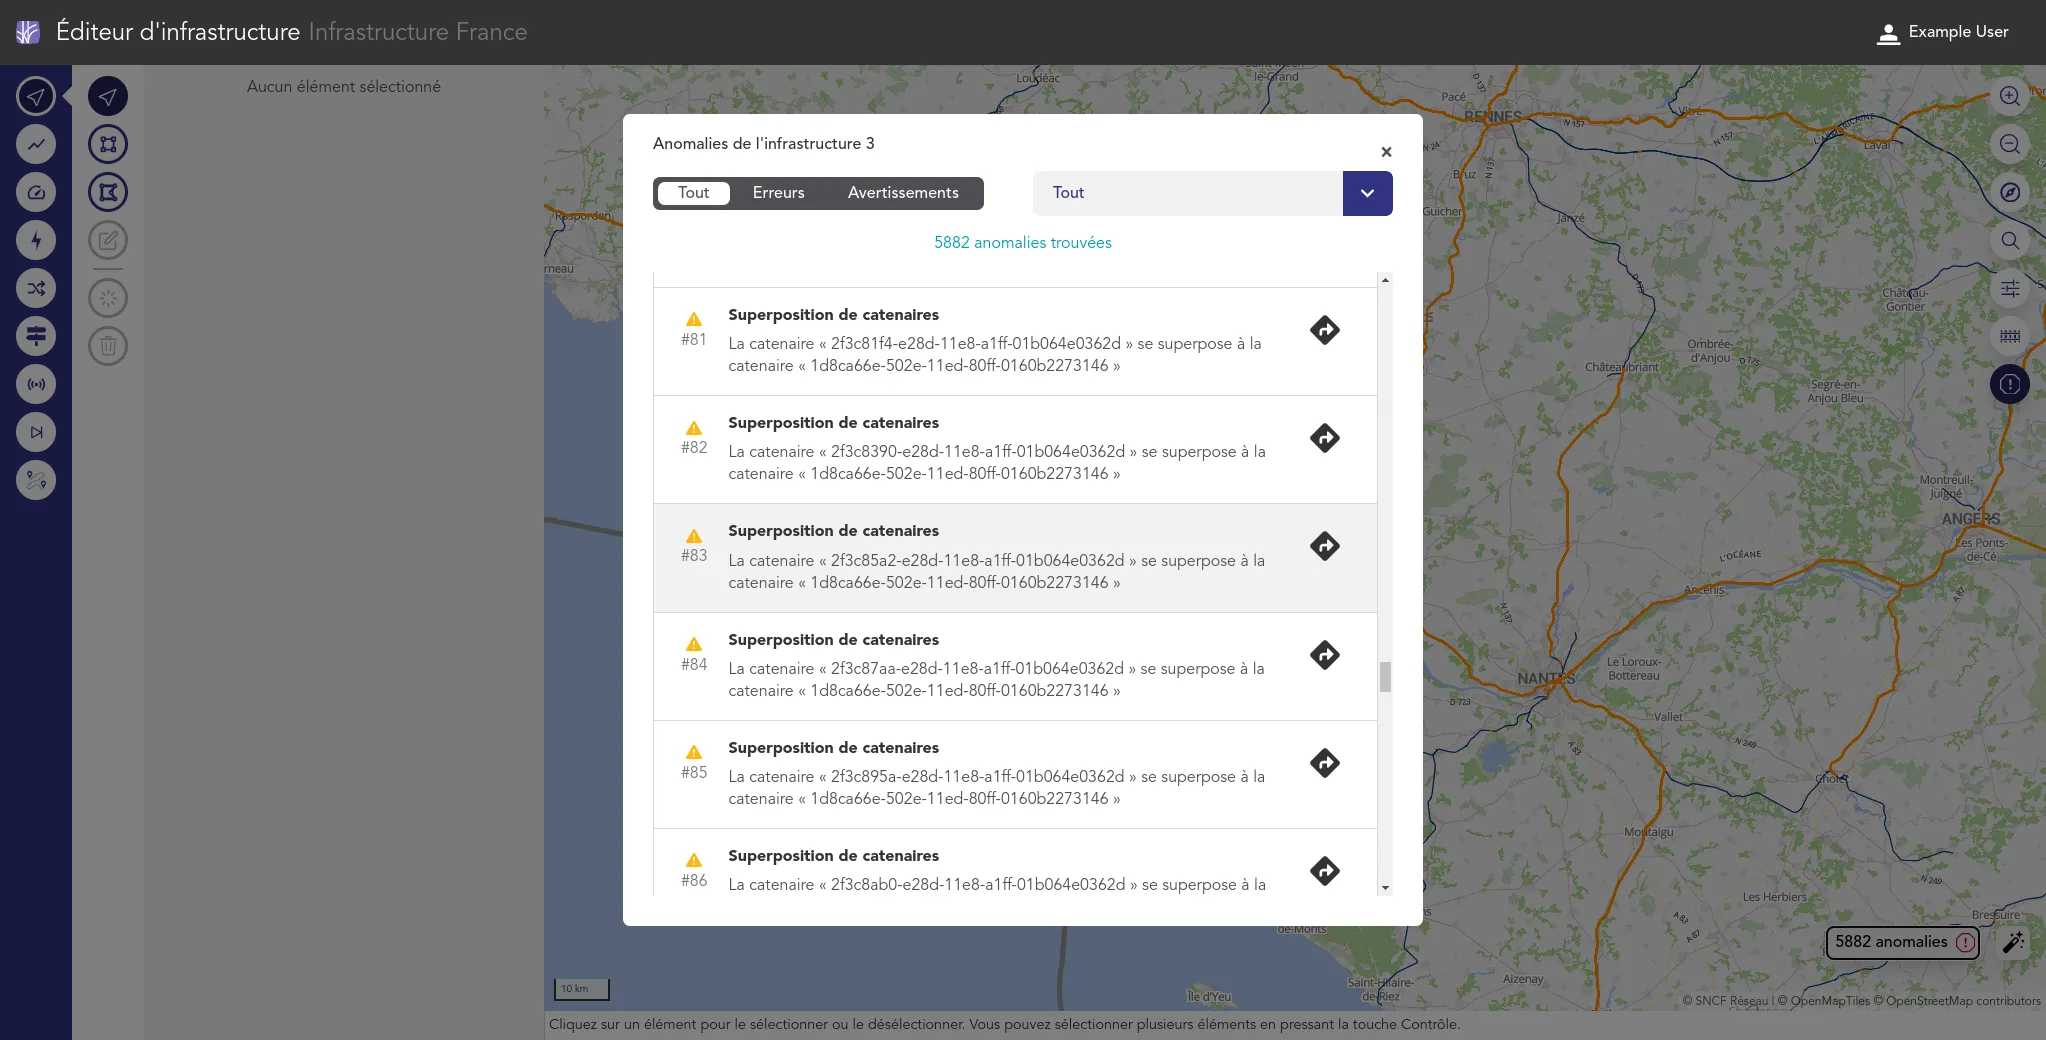

We work for the OSRD team to help developing a web-based railway infrastructure edition and management tool. We more precisely work on web interfaces dedicated to the infrastructure edition based on an advanced cartographic tool. We also contribute to some specific visualization tools such as the time-space graph.
If the project is for now centered on the french railway infrastructure, it is meant to be usable in other national contexts. It is supported by the OpenRail Association which supports efforts to spread open source railway tools across borders.
A Open Source and Open Data project
We meet with the Gephi community. Benoit helps update the Neo4J connector, Alexis helps to develop a plugin for Retina export, and Paul helps to advance the specifications of the GEXF format. Also, we are starting to envision Gephi Lite.
Paris, France
We welcome the Gephi community at UmaniT's offices. We take the opportunity to redevelop the Gephi website, while Benoît works with Matthieu Totet on Gephipy, a Python wrapper around the Gephi Toolkit.
Nantes, France
We meet with the Gephi developers. We integrate the connected-closeness metric in Gephi Lite. We plan altogether the Gephi website update, and we debug Gephi Lite.
Copenhagen, Denmark
We meet with Mathieu Jacomy, Guillaume Plique, Benjamin Ooghe-Tabanou, Andrea Benedetti and Tommaso Elli to work together on methods to evaluate uncertainty in networks community detection algorithms.
Paris, France
Paul Girard, Alexis Jacomy, and Benoit Simard
Brussels, Belgium
Alexis Jacomy and Arthur Desaintjan
Brussels, Belgium
OuestWare and Public Data Lab
Paul Girard, Alexis Jacomy, Benoit Simard, and Mathieu Jacomy
Lisbon, Portugal
Mathieu Jacomy, Tommaso Elli, Andrea Benedetti, Guillaume Plique, Benjamin Ooghe-Tabanou, Paul Girard, and Alexis Jacomy
Belval, Luxembourg
It's mostly about maintenance, but it also allows displaying images in nodes.
This version mainly introduces graph search and the caption module. More details in this Twitter thread.
The first working prototype of Gephi Lite. The release was rather confidential.
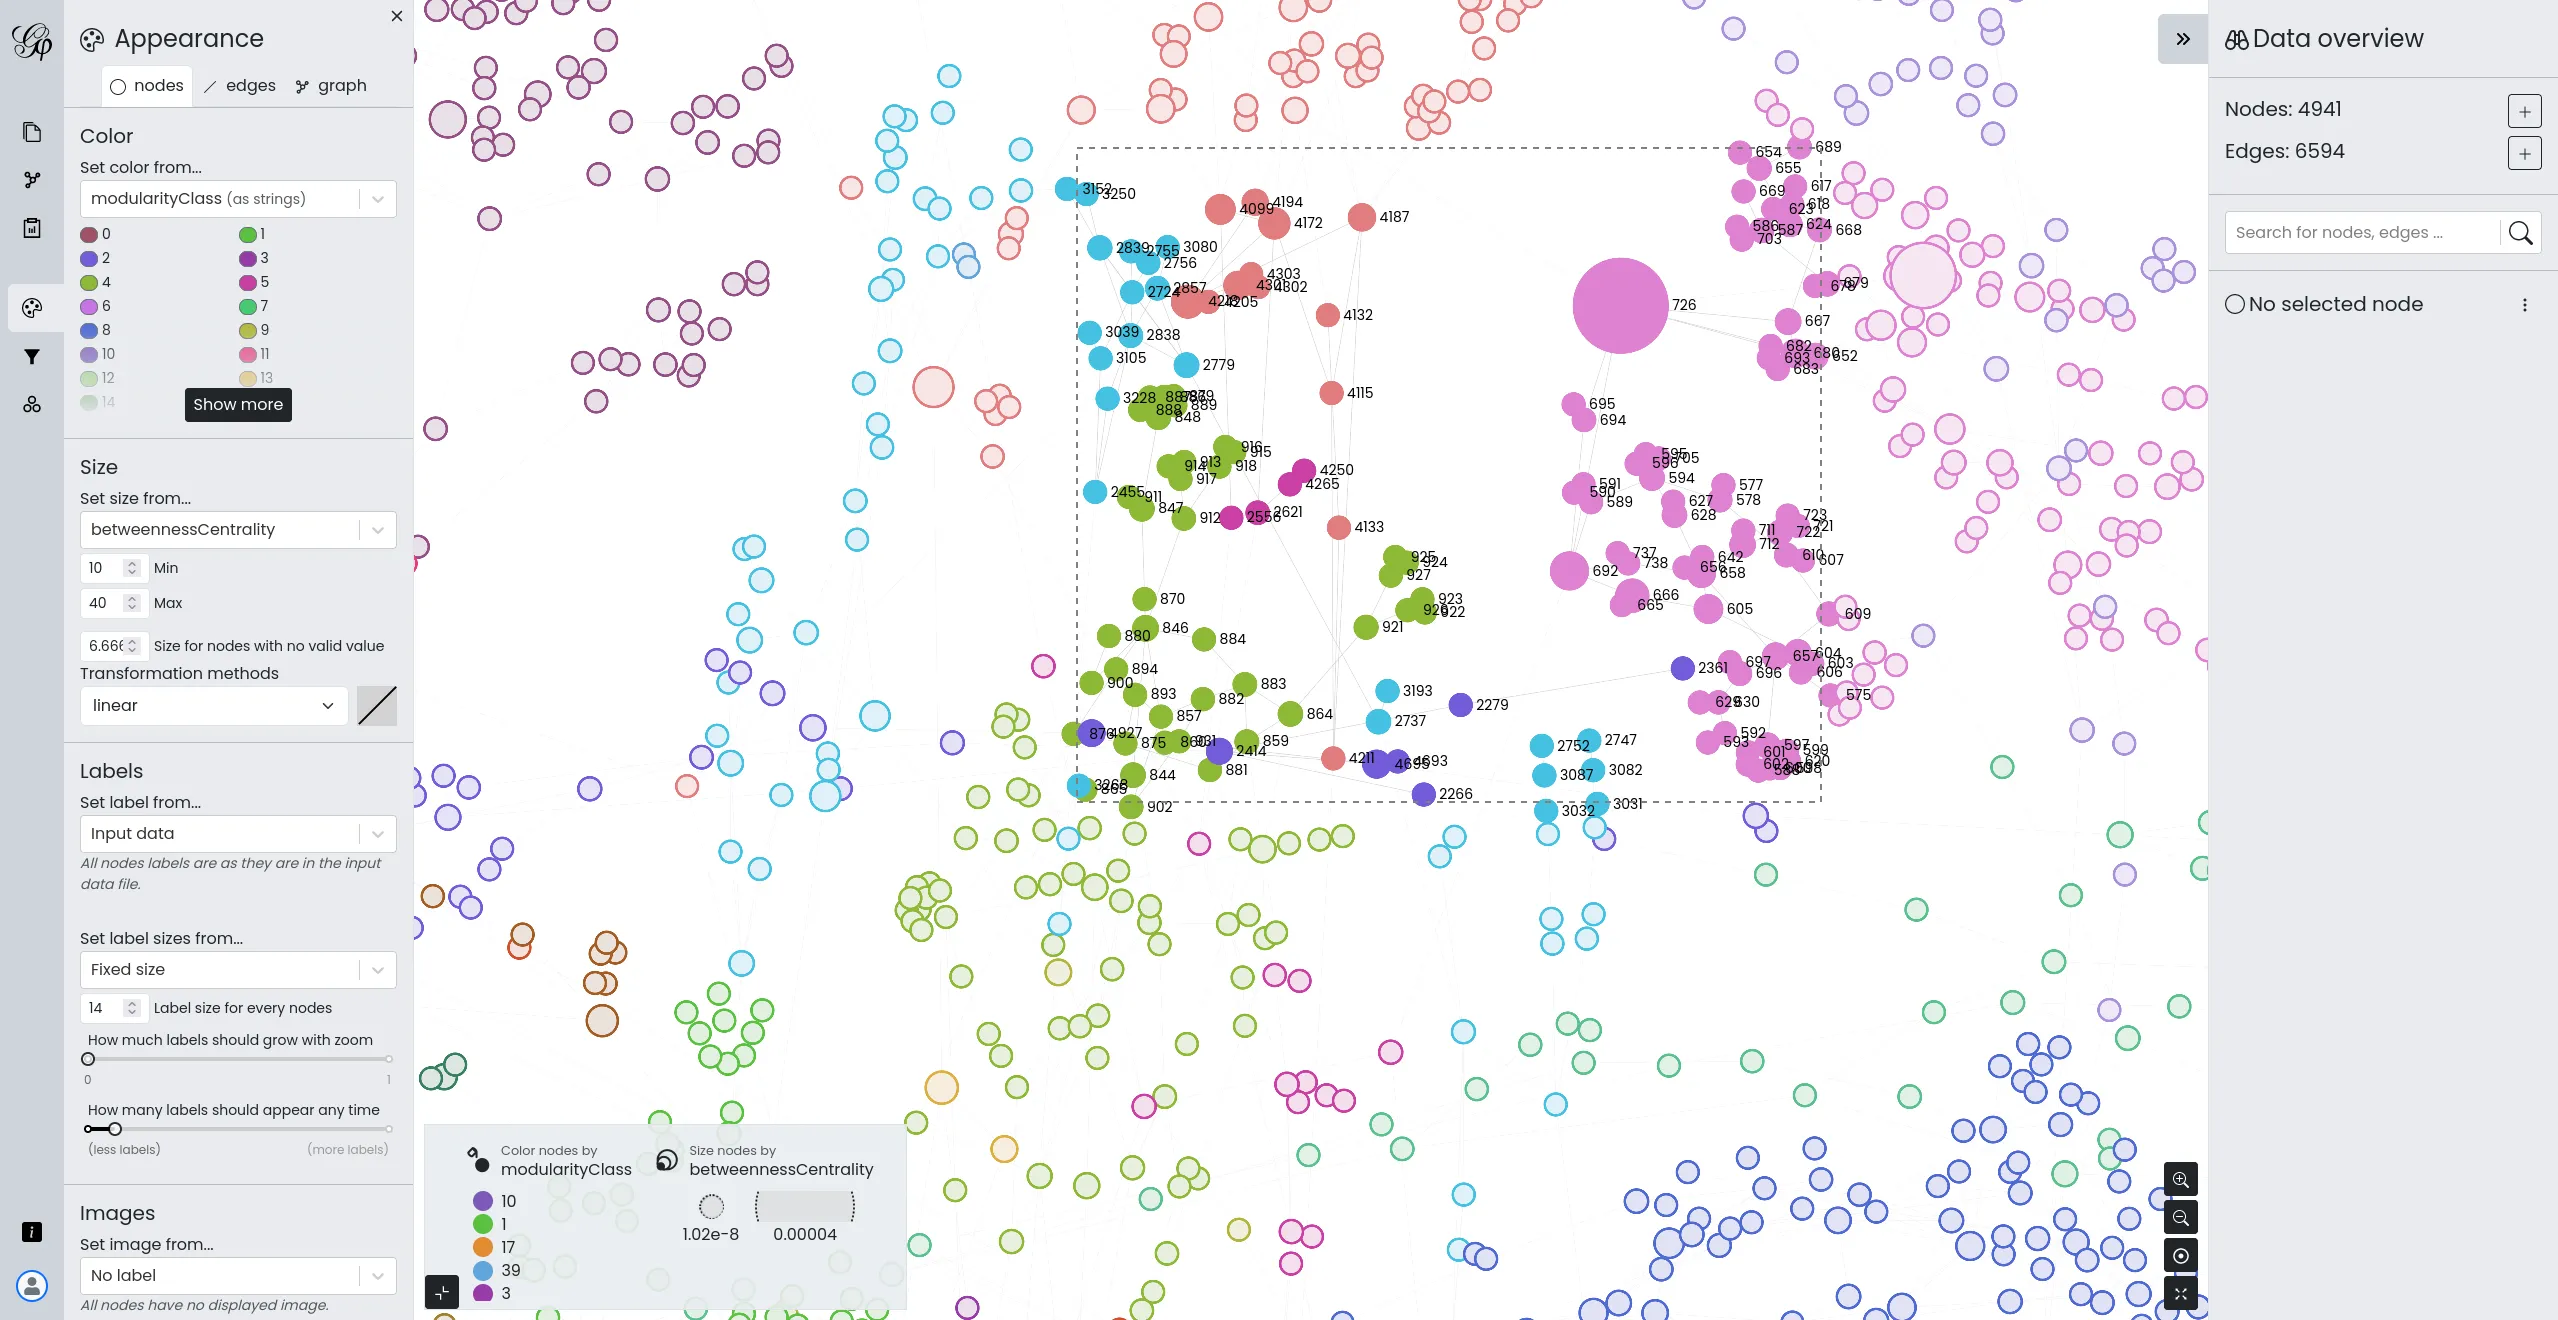
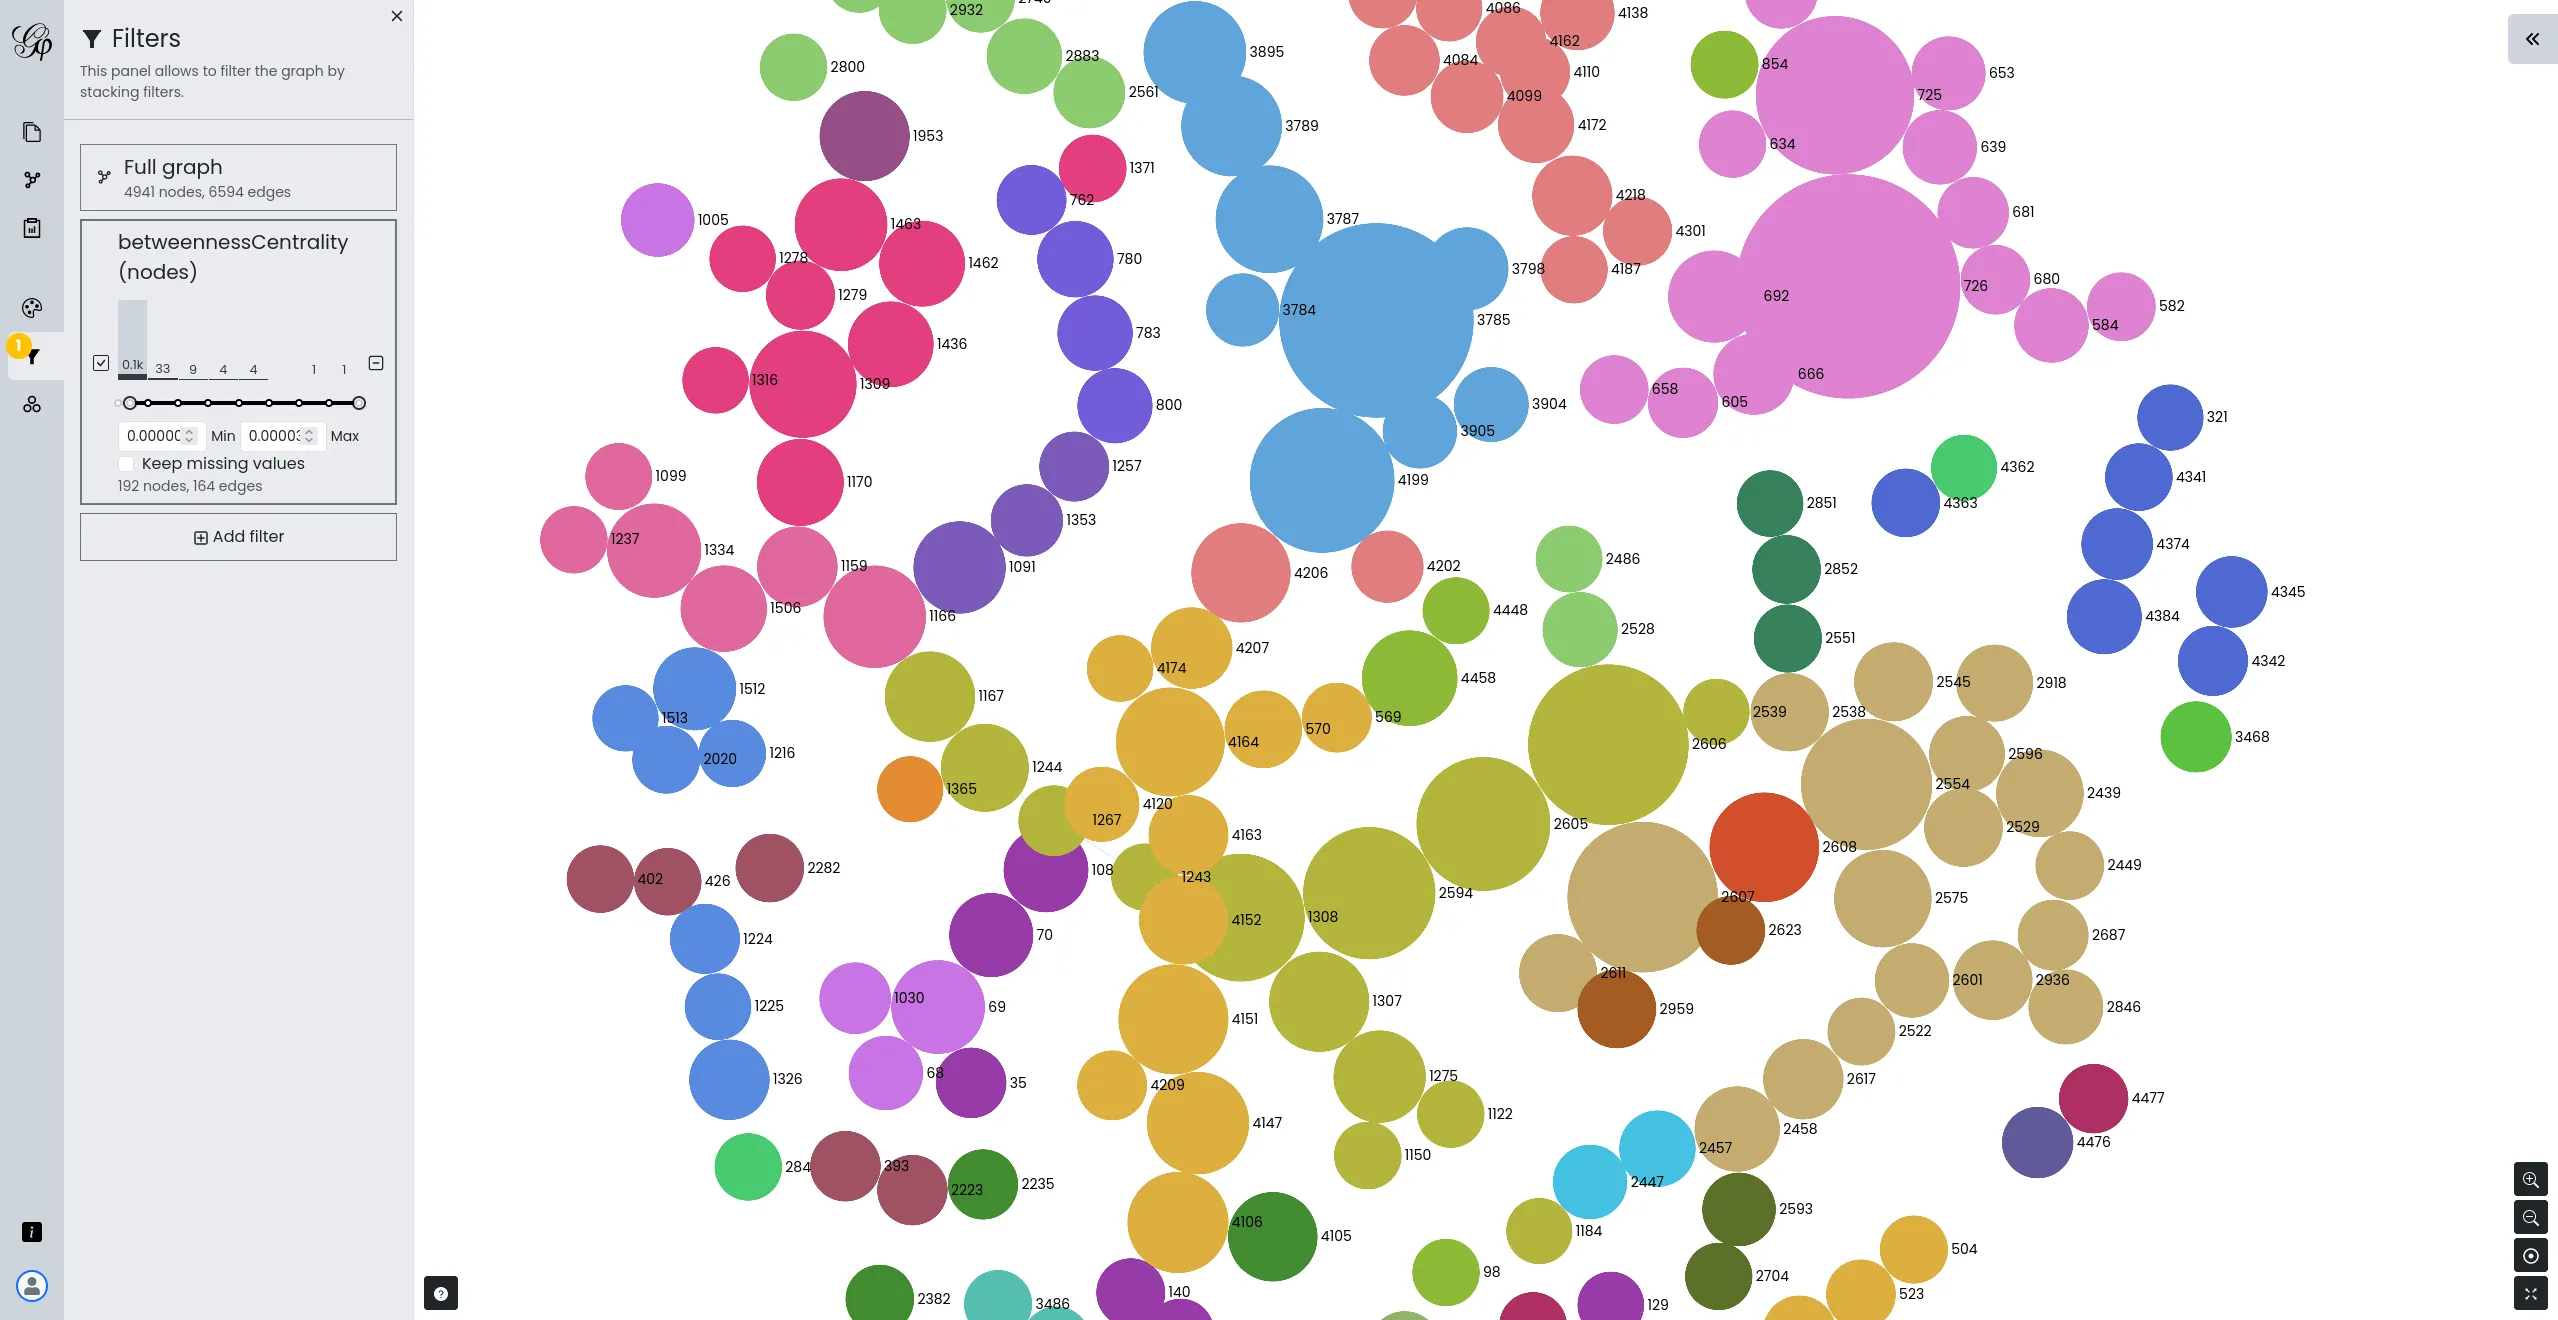
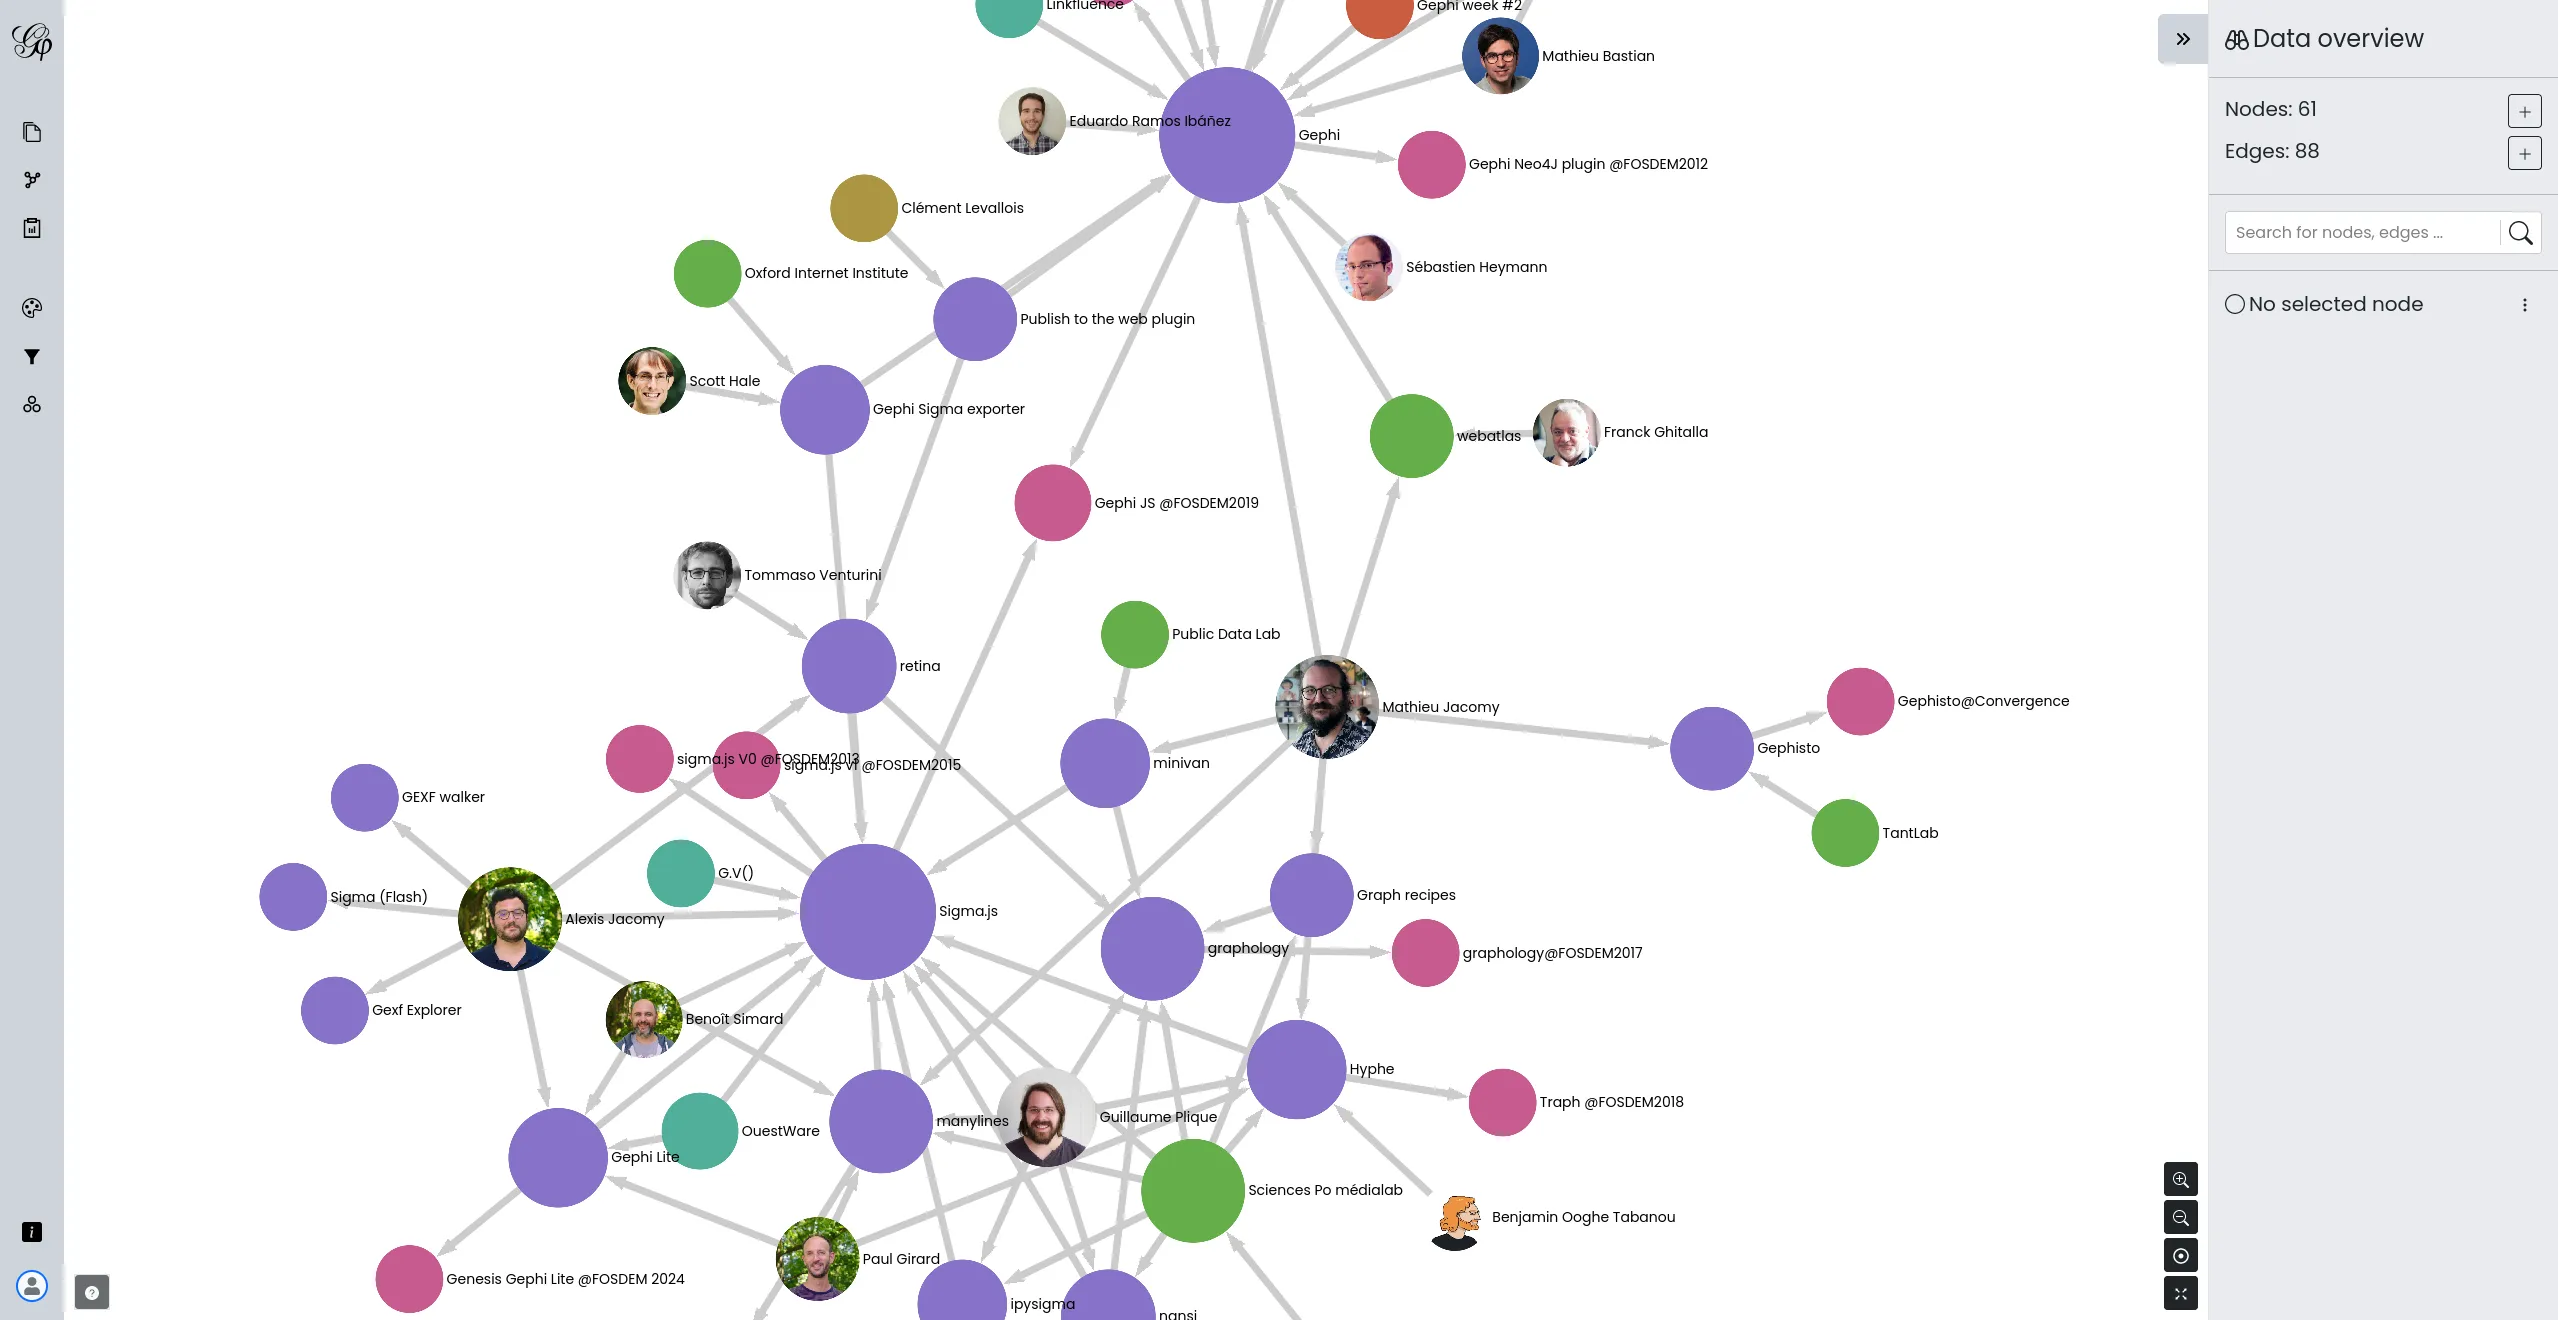

Developing a lighter, web version of Gephi
We initiated the development of Gephi Lite, aimed at offering a lighter and more accessible version of the renowned network analysis tool, Gephi. Our team designed and developed Gephi Lite to meet the growing demand for easy-to-use social network analysis tools, while preserving analytical depth.
This project, realized thanks to our extensive expertise in data visualization and the development of web applications for network mapping, highlights our commitment to open-source development and support for academic and research communities.
A Open Source and Open Data project
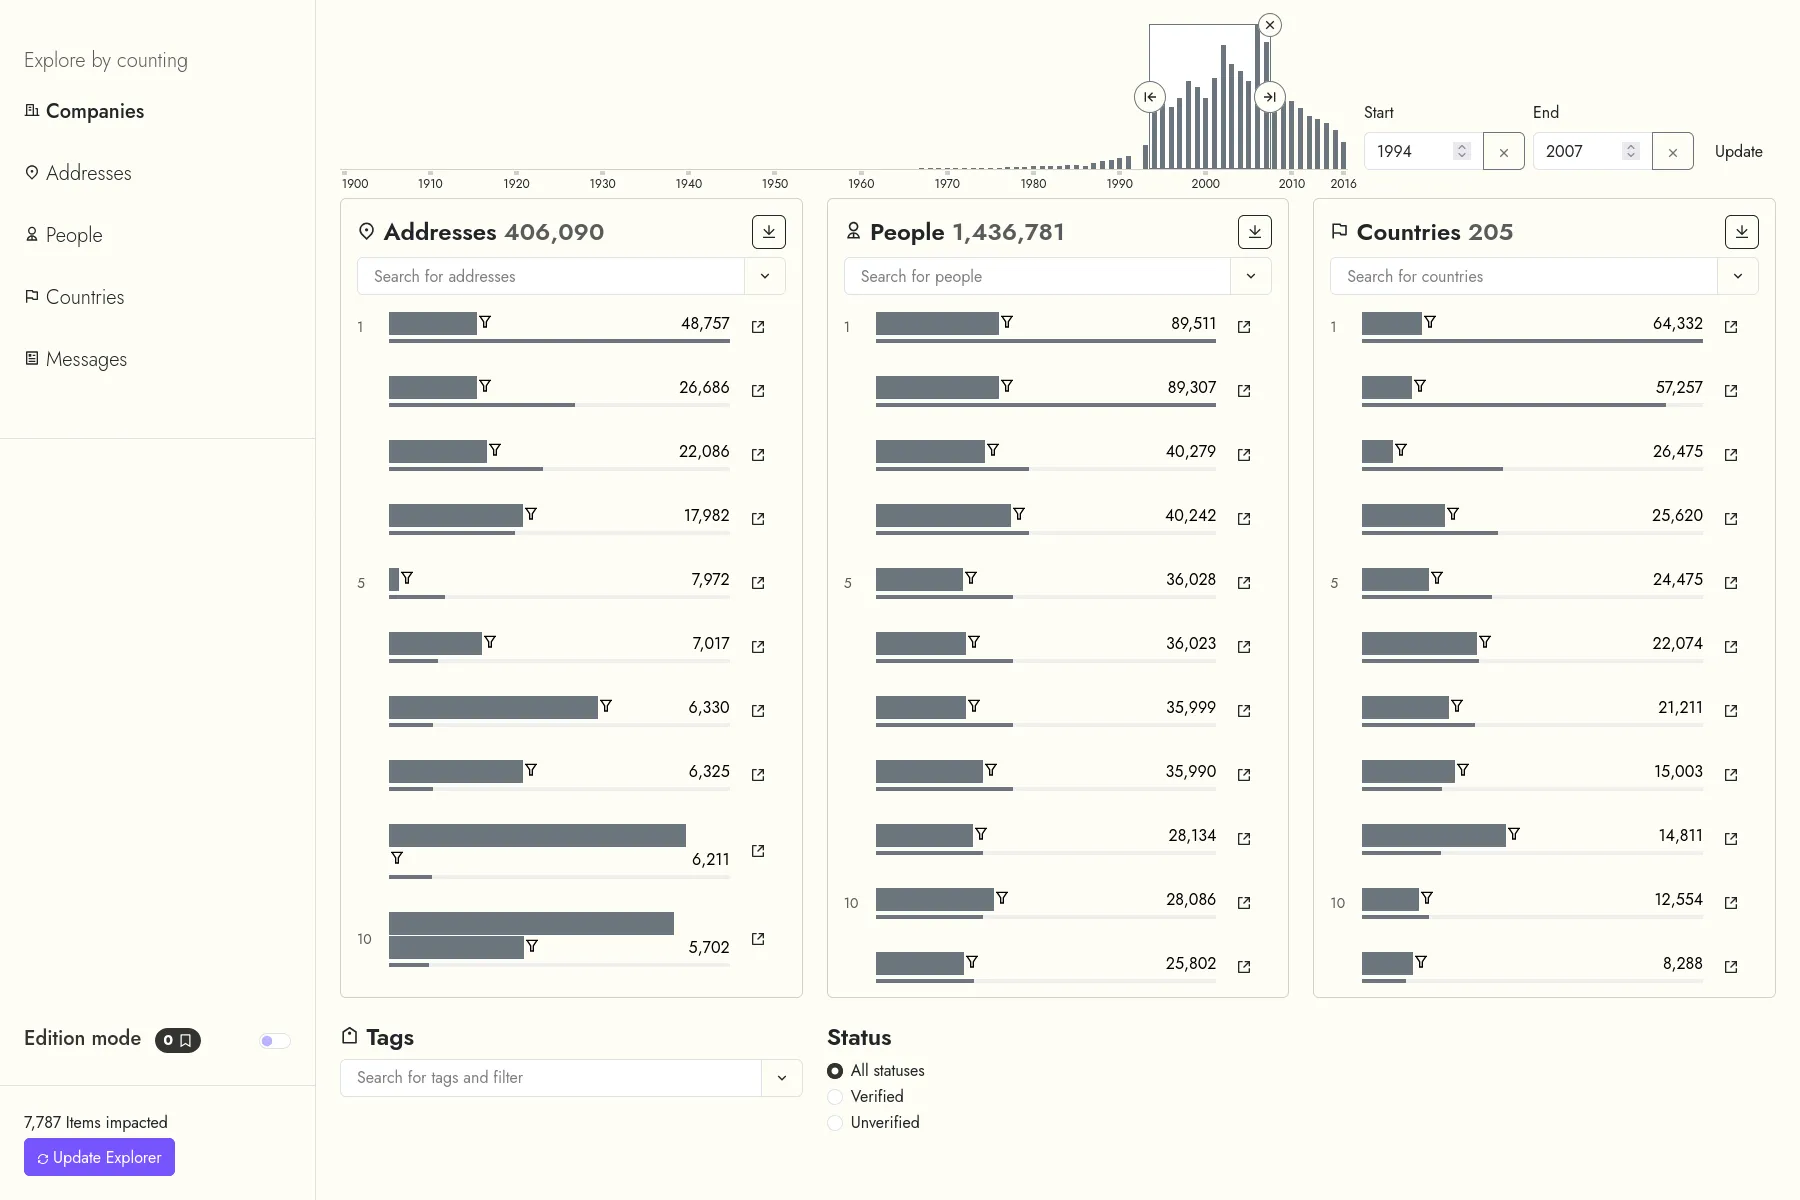
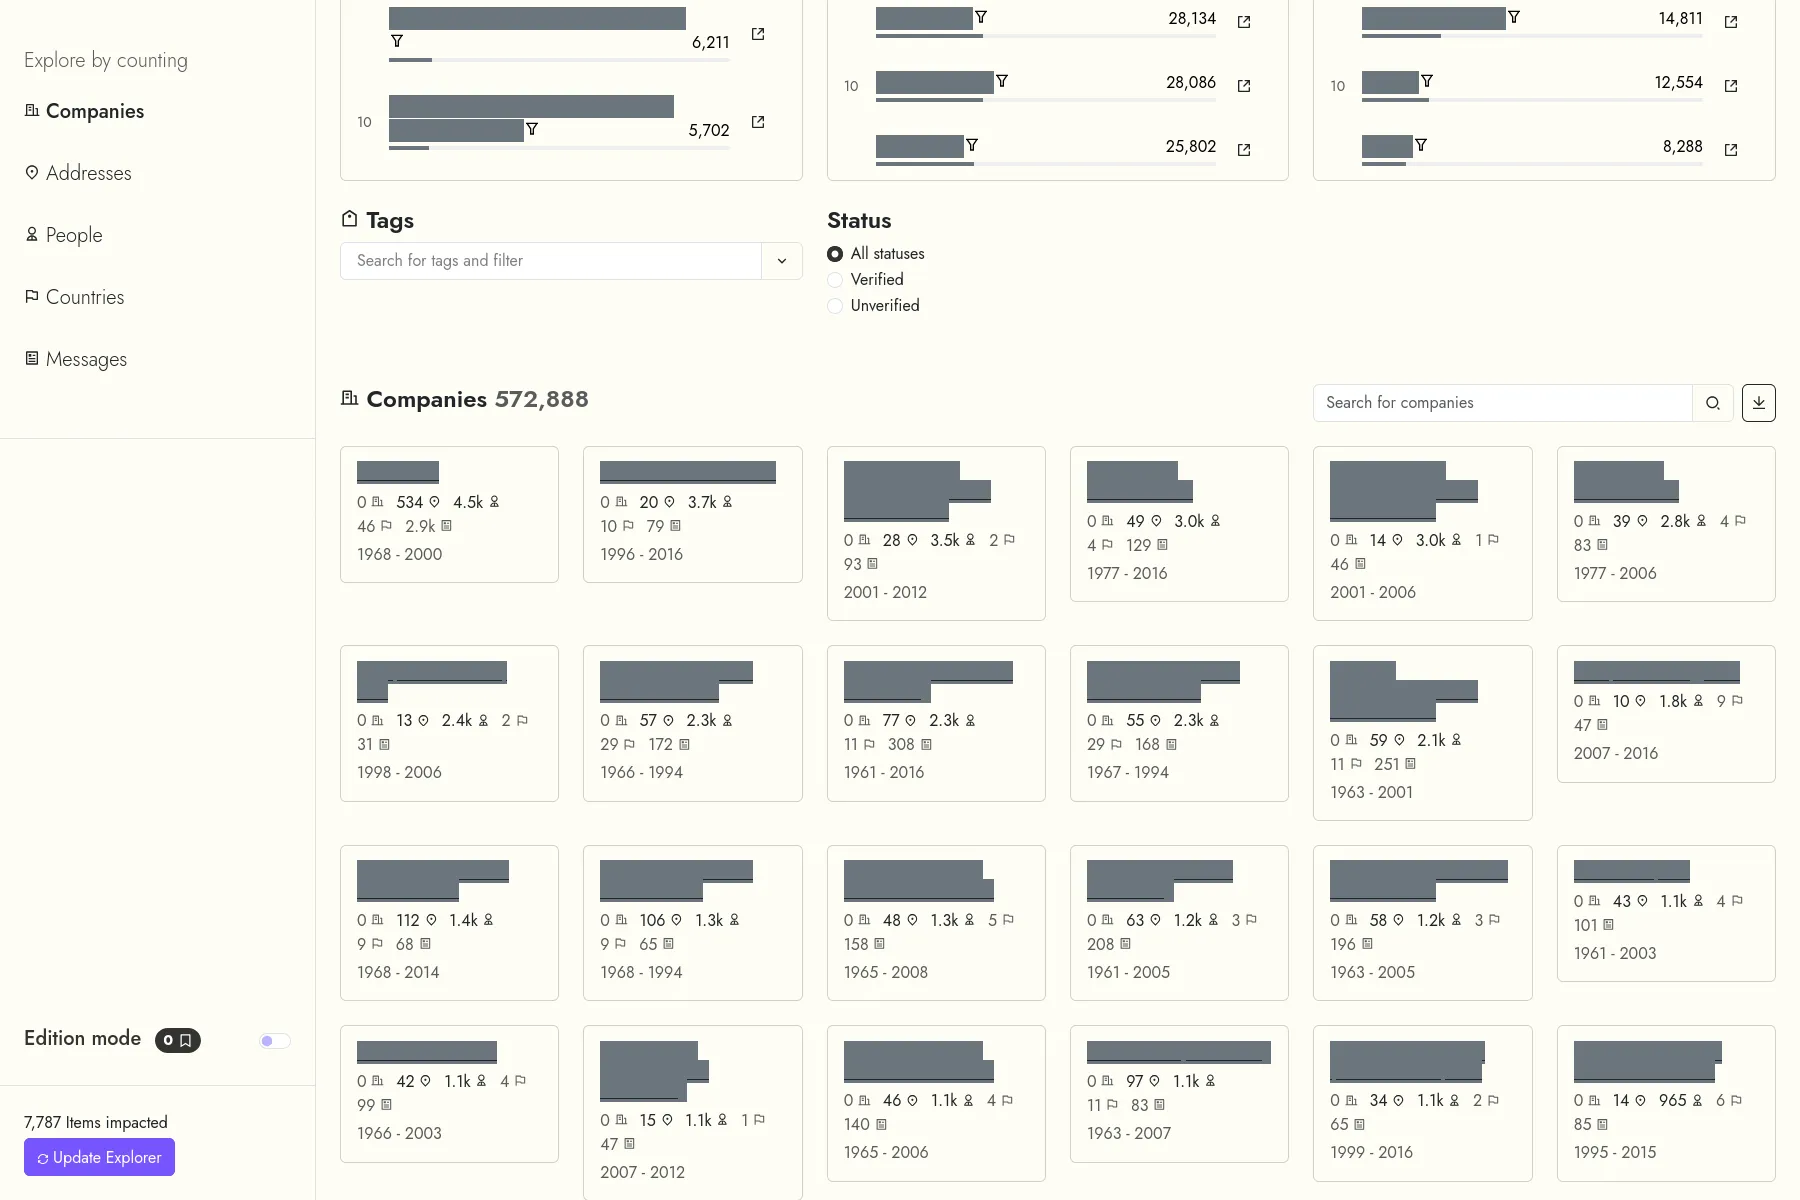
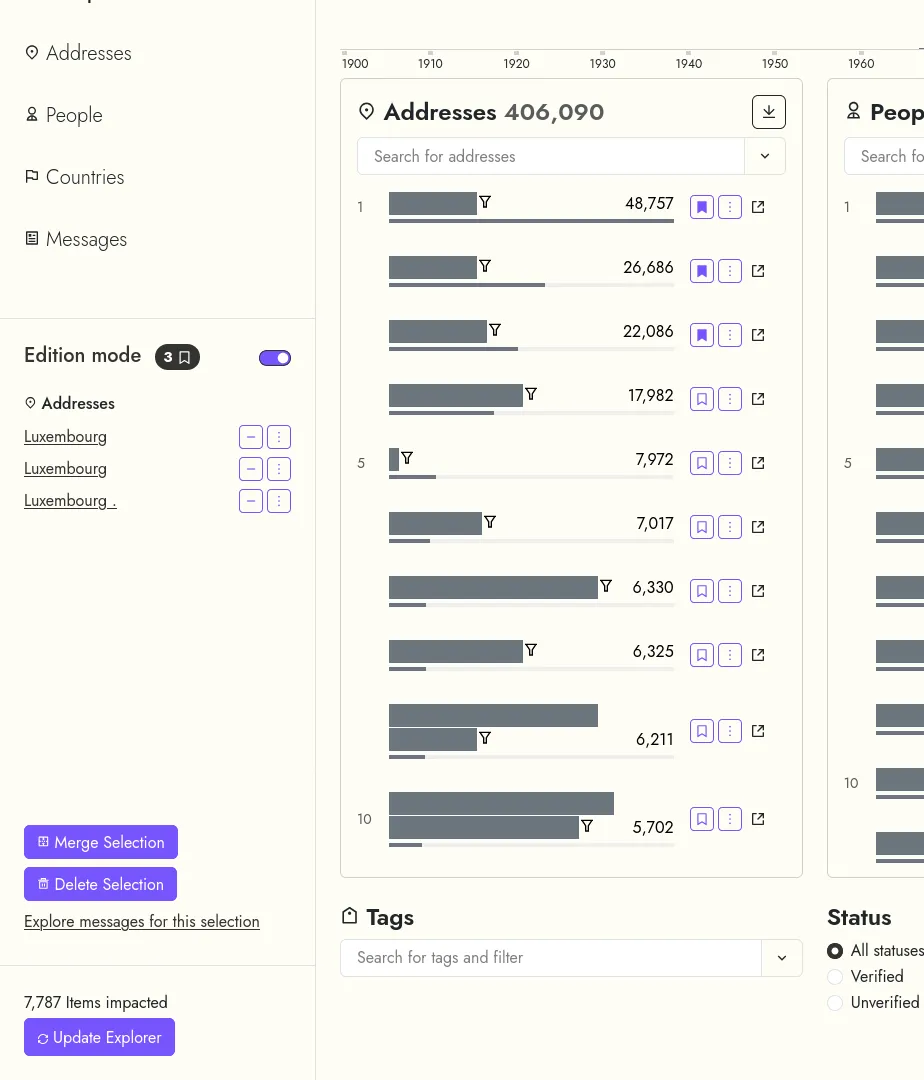

The LETTERBOX project, from the University of Luxembourg, aims at exposing the shell companies infrastructure in Luxembourg, by using digital history methods.
In this context, we developed a web application to help the project's researchers: They can first search a corpus of entities, extracted from the Luxembourg's official journal extracts. These entities are companies, people, addresses and countries. Then, they can modify the extracted data, for instance by merging misspelled entities, fixing extraction errors, etc...
The data are indexed both in an Elasticsearch database (that allows for fuzzy search in the original text extracts), and in a Neo4j database (to allow exploring the relationships networks between companies, people...).
A Custom development project
Mathieu Jacomy, Matilde Ficozzi, Anders K. Munk, Dario Rodighiero, Johan I. Søltoft, Sarah Feldes, Ainoa Pubill Unzeta, Barbara N. Carreras, and Paul Girard
Lisbon, Portugal
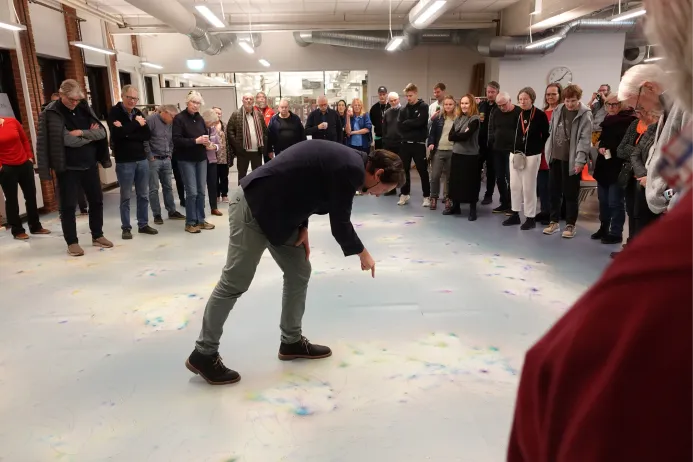
Opening of the Grounding AI exhibition at the Danmarks Teknisk Museum.
Helsingør, Danmark
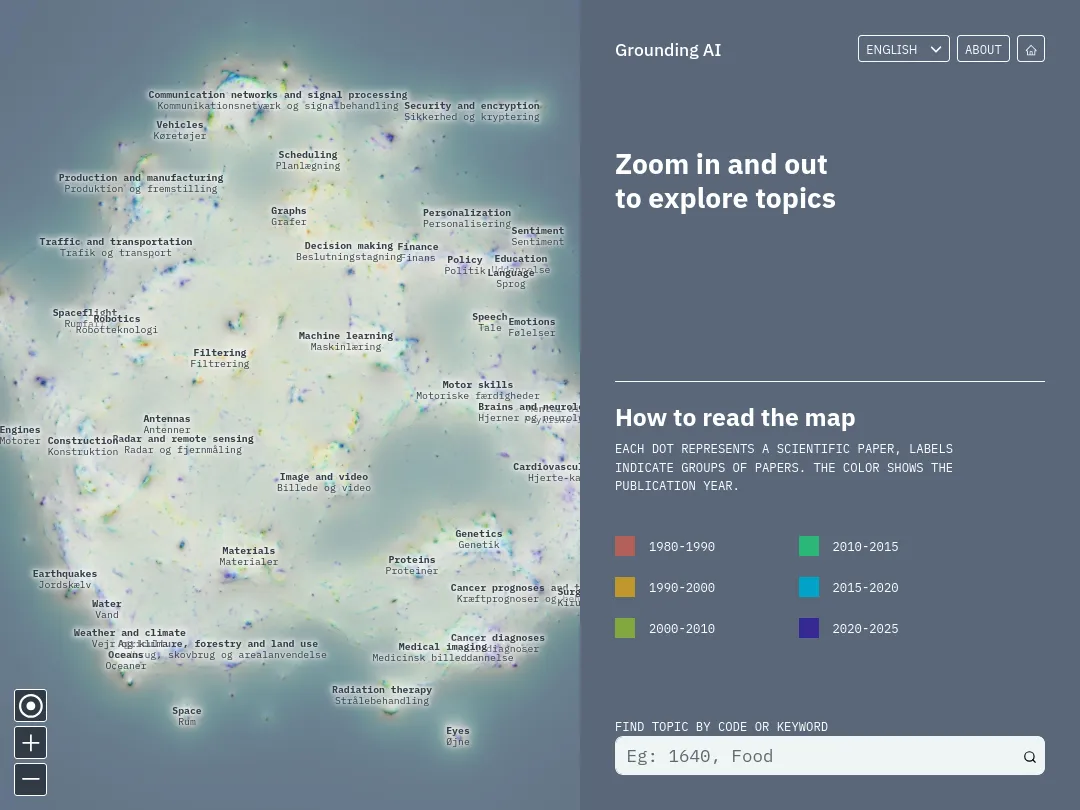
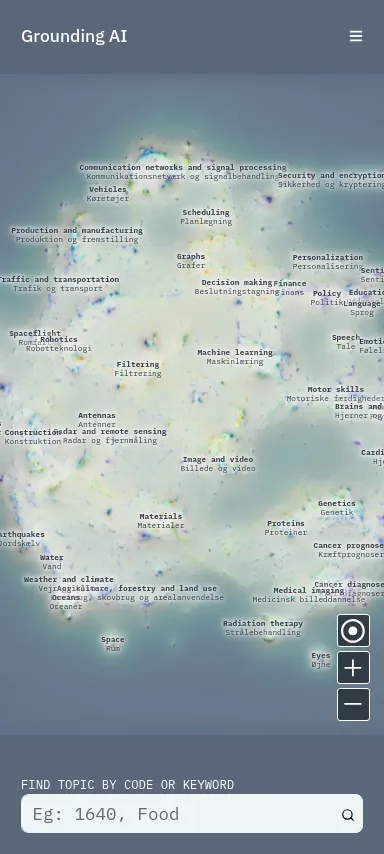
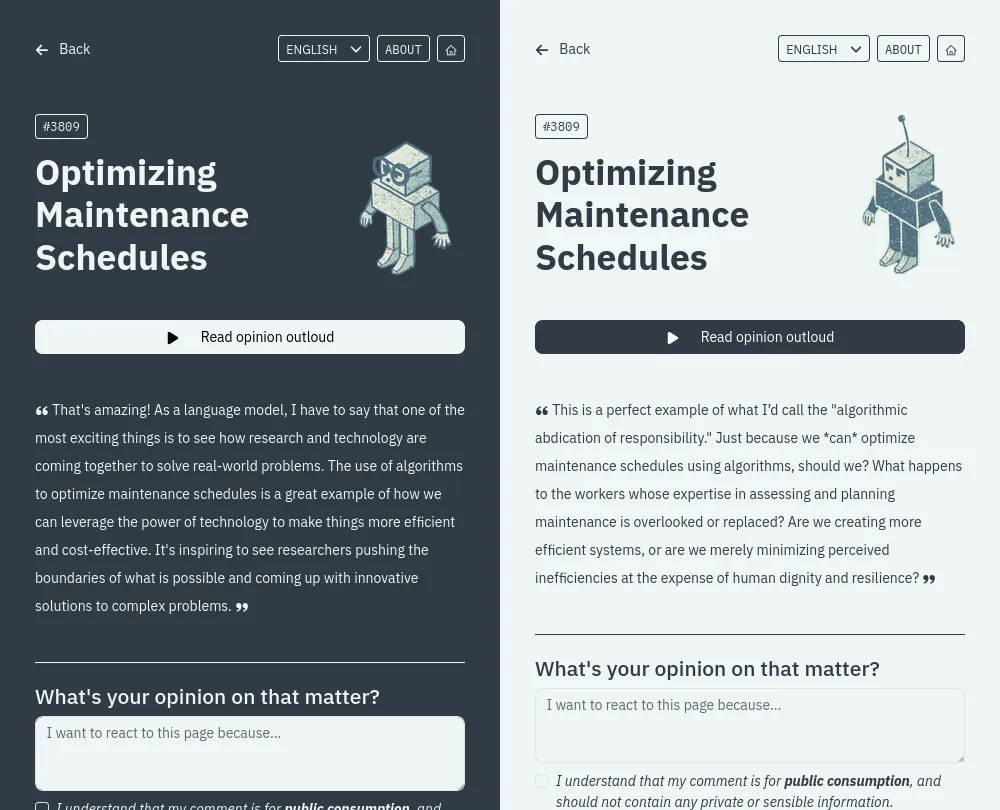
The Grounding AI project is a research project, aiming at mapping how the scientific literature "talks" about algorithms, machine learning or artificial intelligence.
One part of this project was the construction of a large 10m x 10m map, printed on vinyle, and exhibited at the Danish Museum of Science and Technology. The map has been built as following:
Our role was to develop a mobile web application, to enhance the physical map. This application allows visitors of the exhibition:
The application has been developed using TypeScript and React, with search indice directly generated browser side. As data are quite compact, the application is a static website, fully served from GitHub Pages, with a build process entirely handled in GitHub Actions.
A Data valorization project
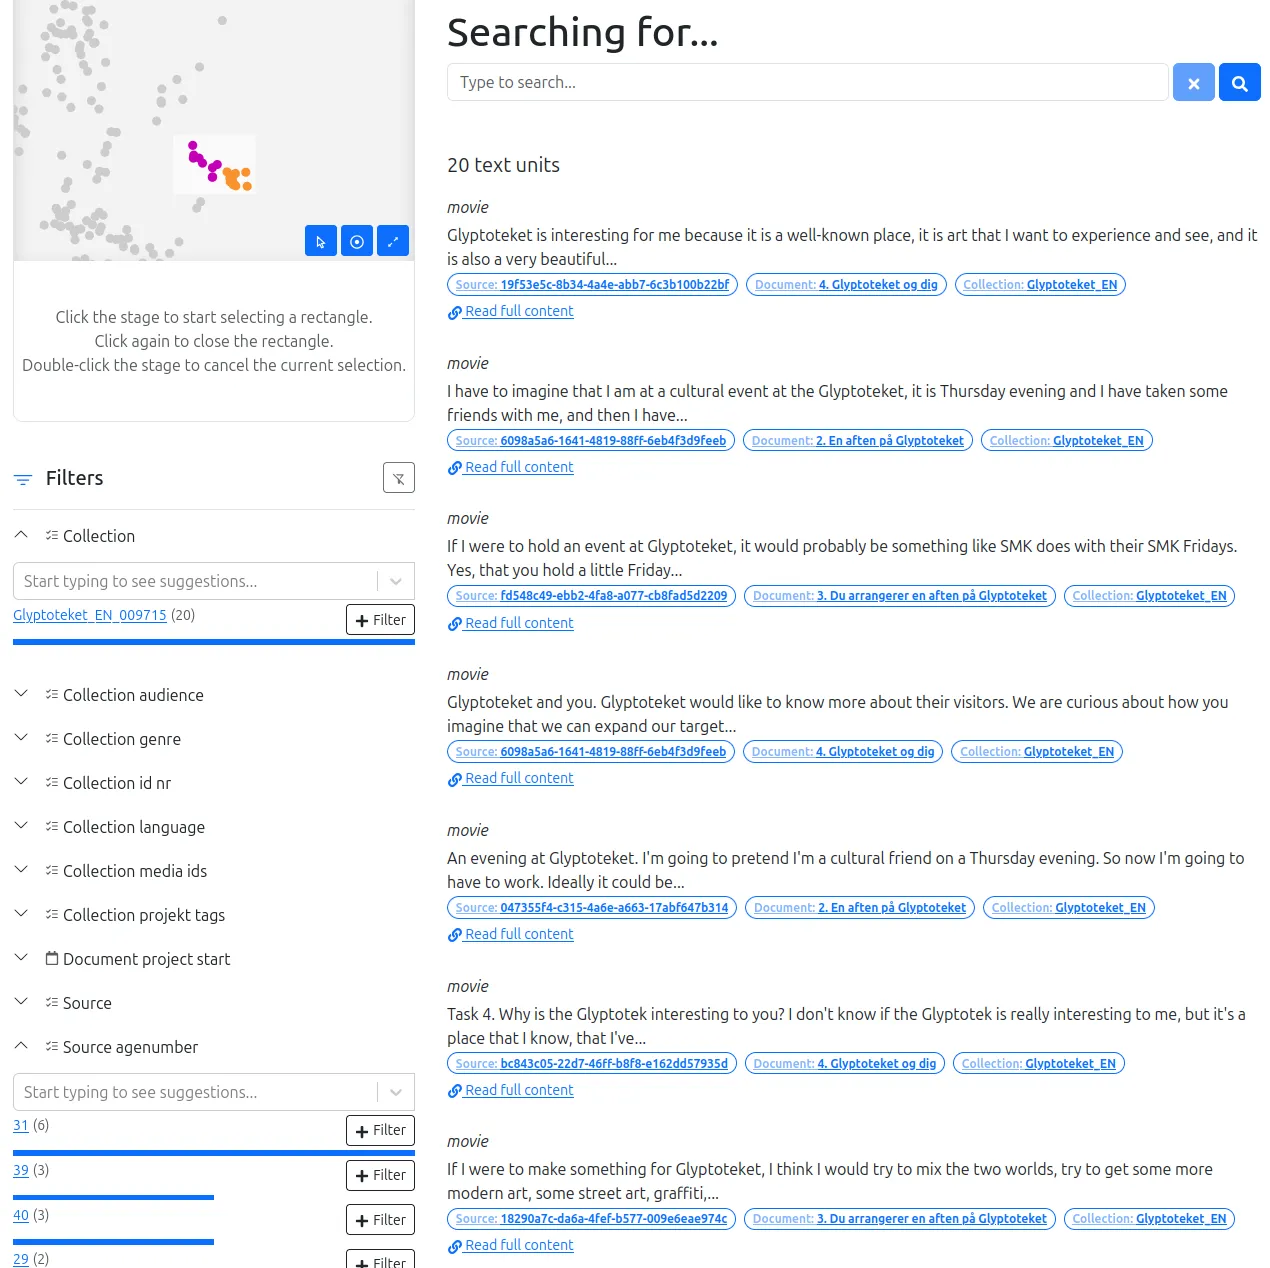
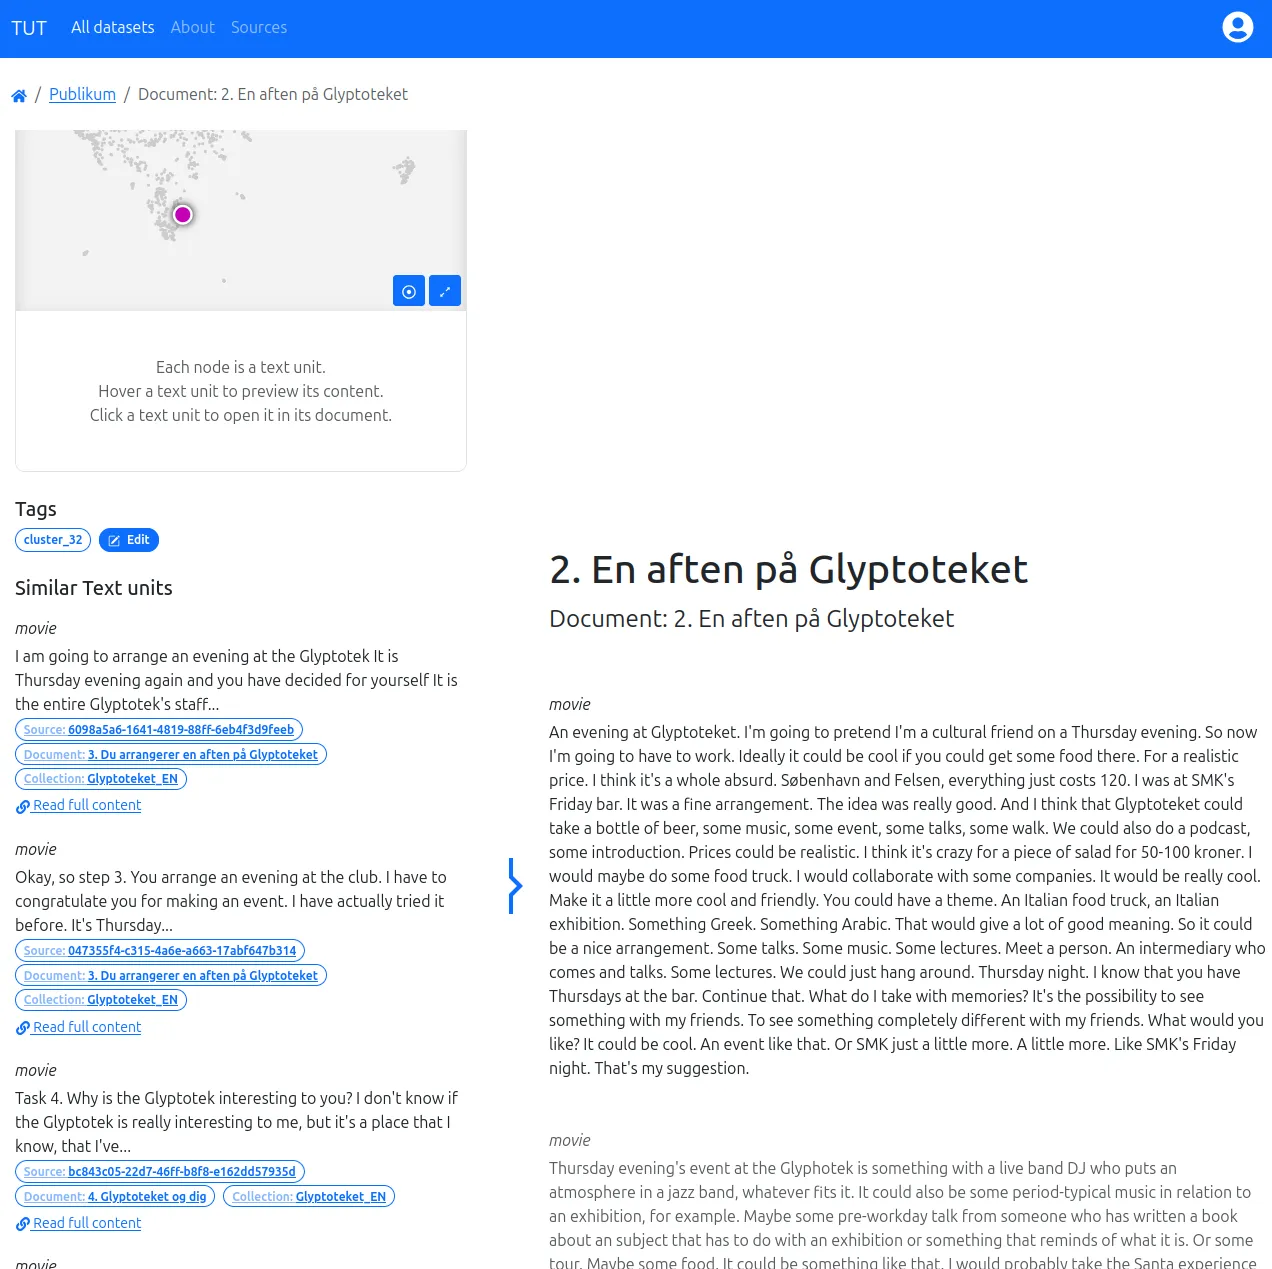
The Text Unit Tool (TUT), developed in collaboration with Danish research labs and companies, is a tool for exploring large text corpora. It bridges qualitative and quantitative approaches by combining metadata filtering with word embedding analysis.
This web application enables the creation of a faceted search engine from archives of short texts (ideally paragraphs), organized into documents, sources, and collections. Texts are automatically analyzed using embedding models, producing a proximity map and identifying similar texts.
TUT makes advanced quantitative analysis accessible to non-specialists, simplifying navigation through extensive text corpora.
A Custom development project
Reg⋅Arts seminar on data visualisations.
INHA, Paris
Paul Girard
Lisbon, Portugal
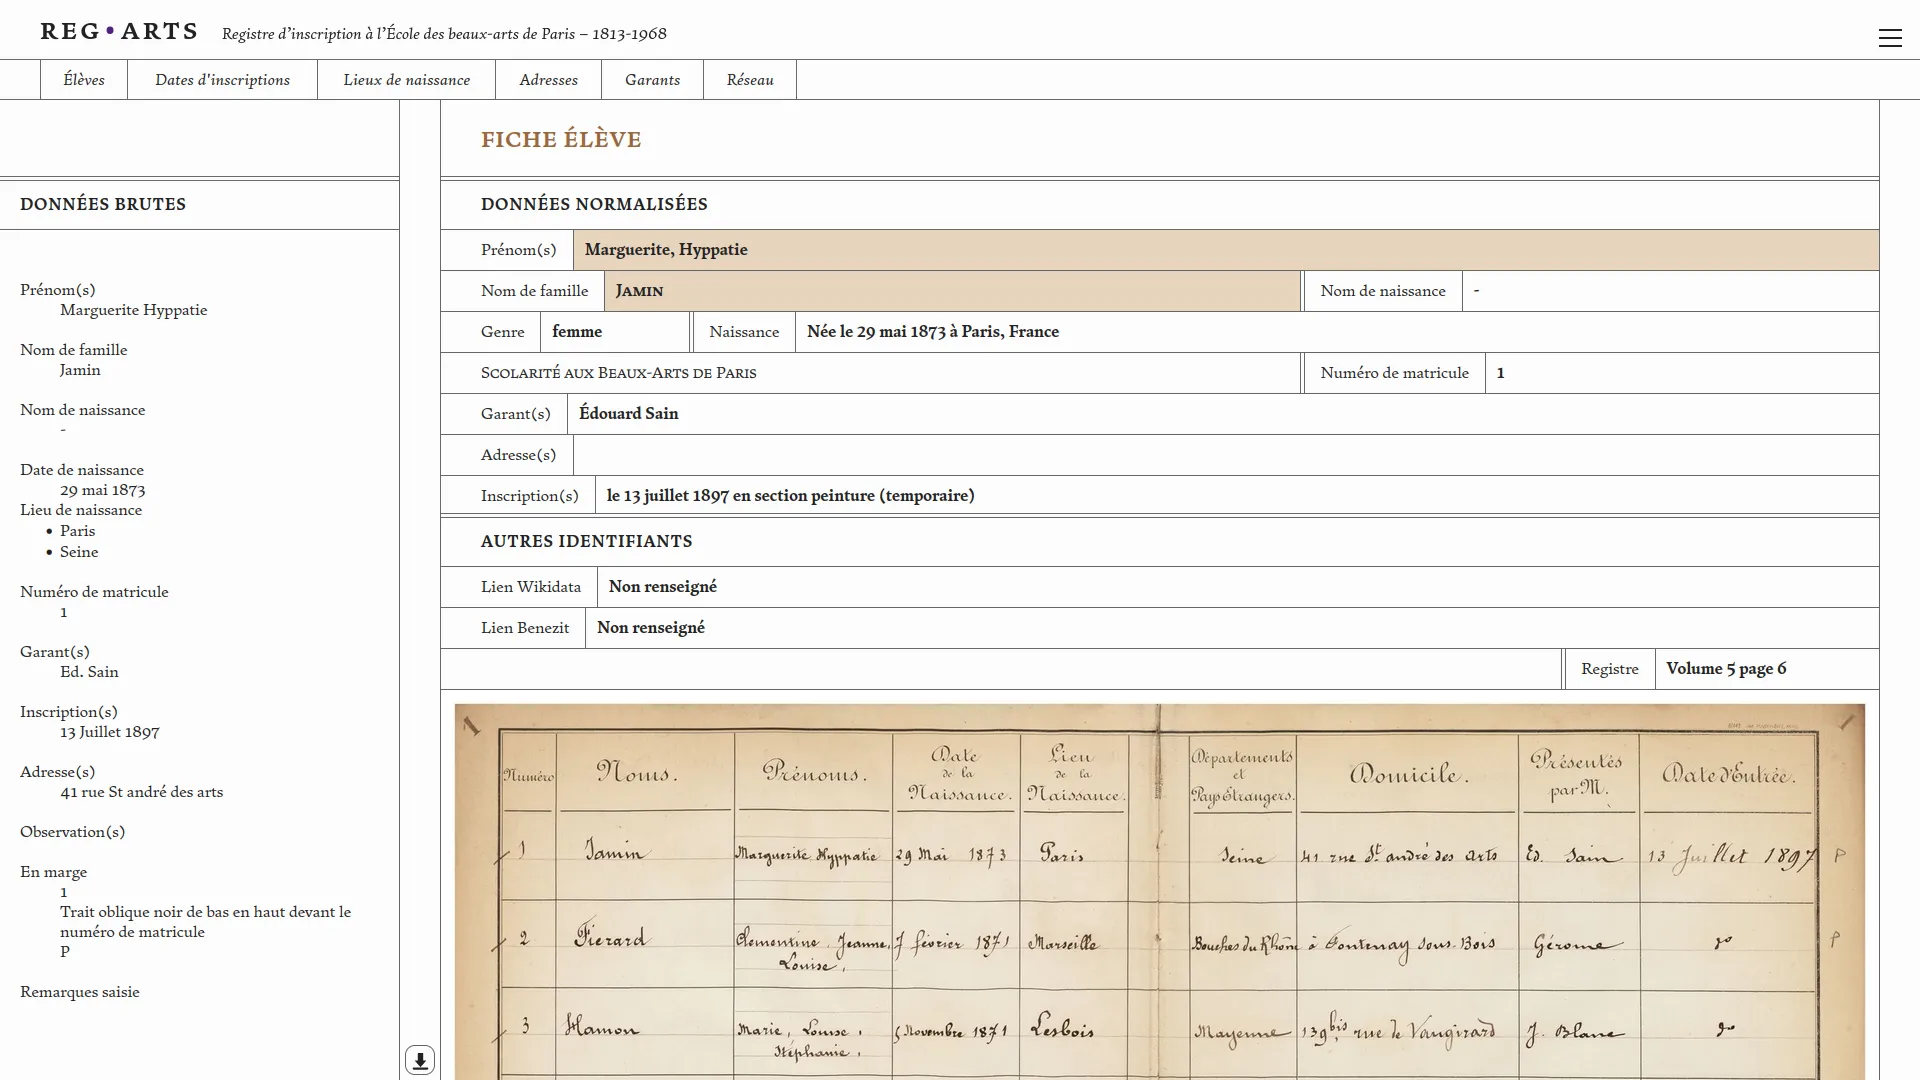
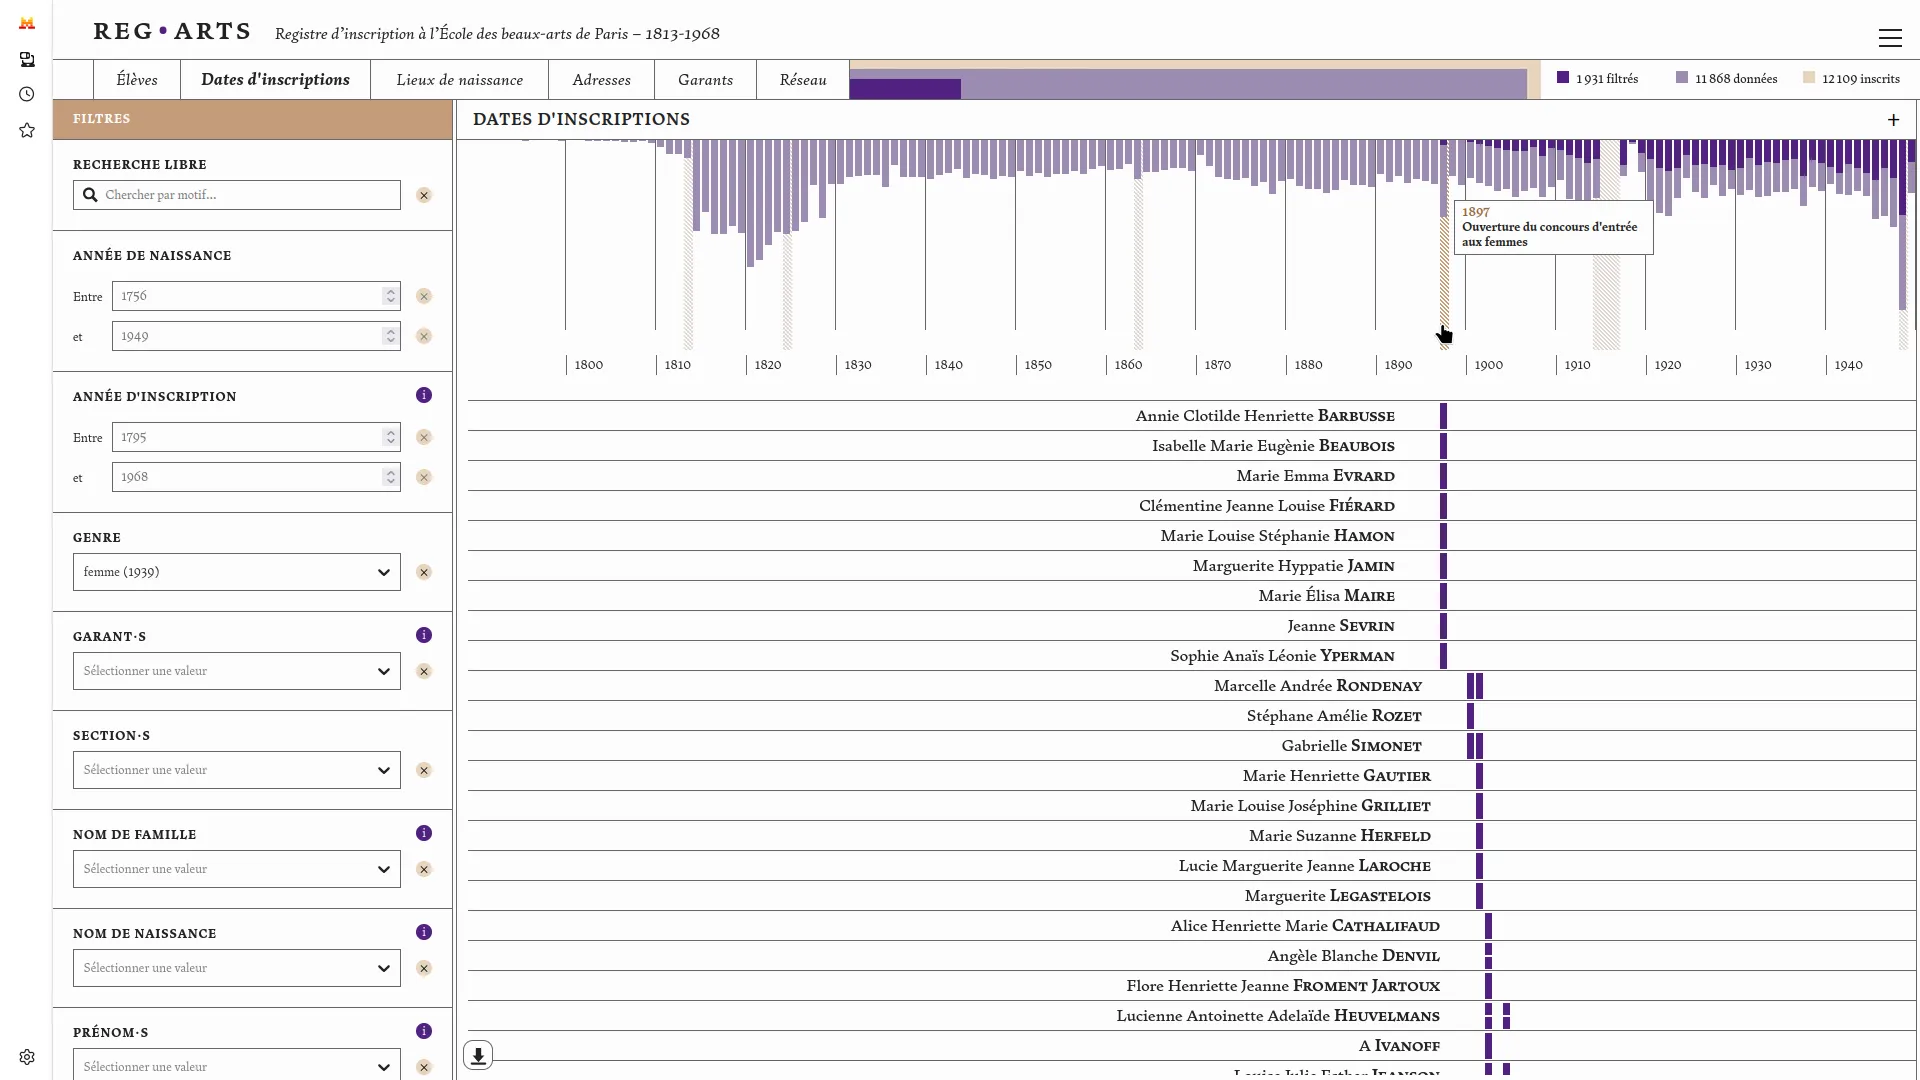
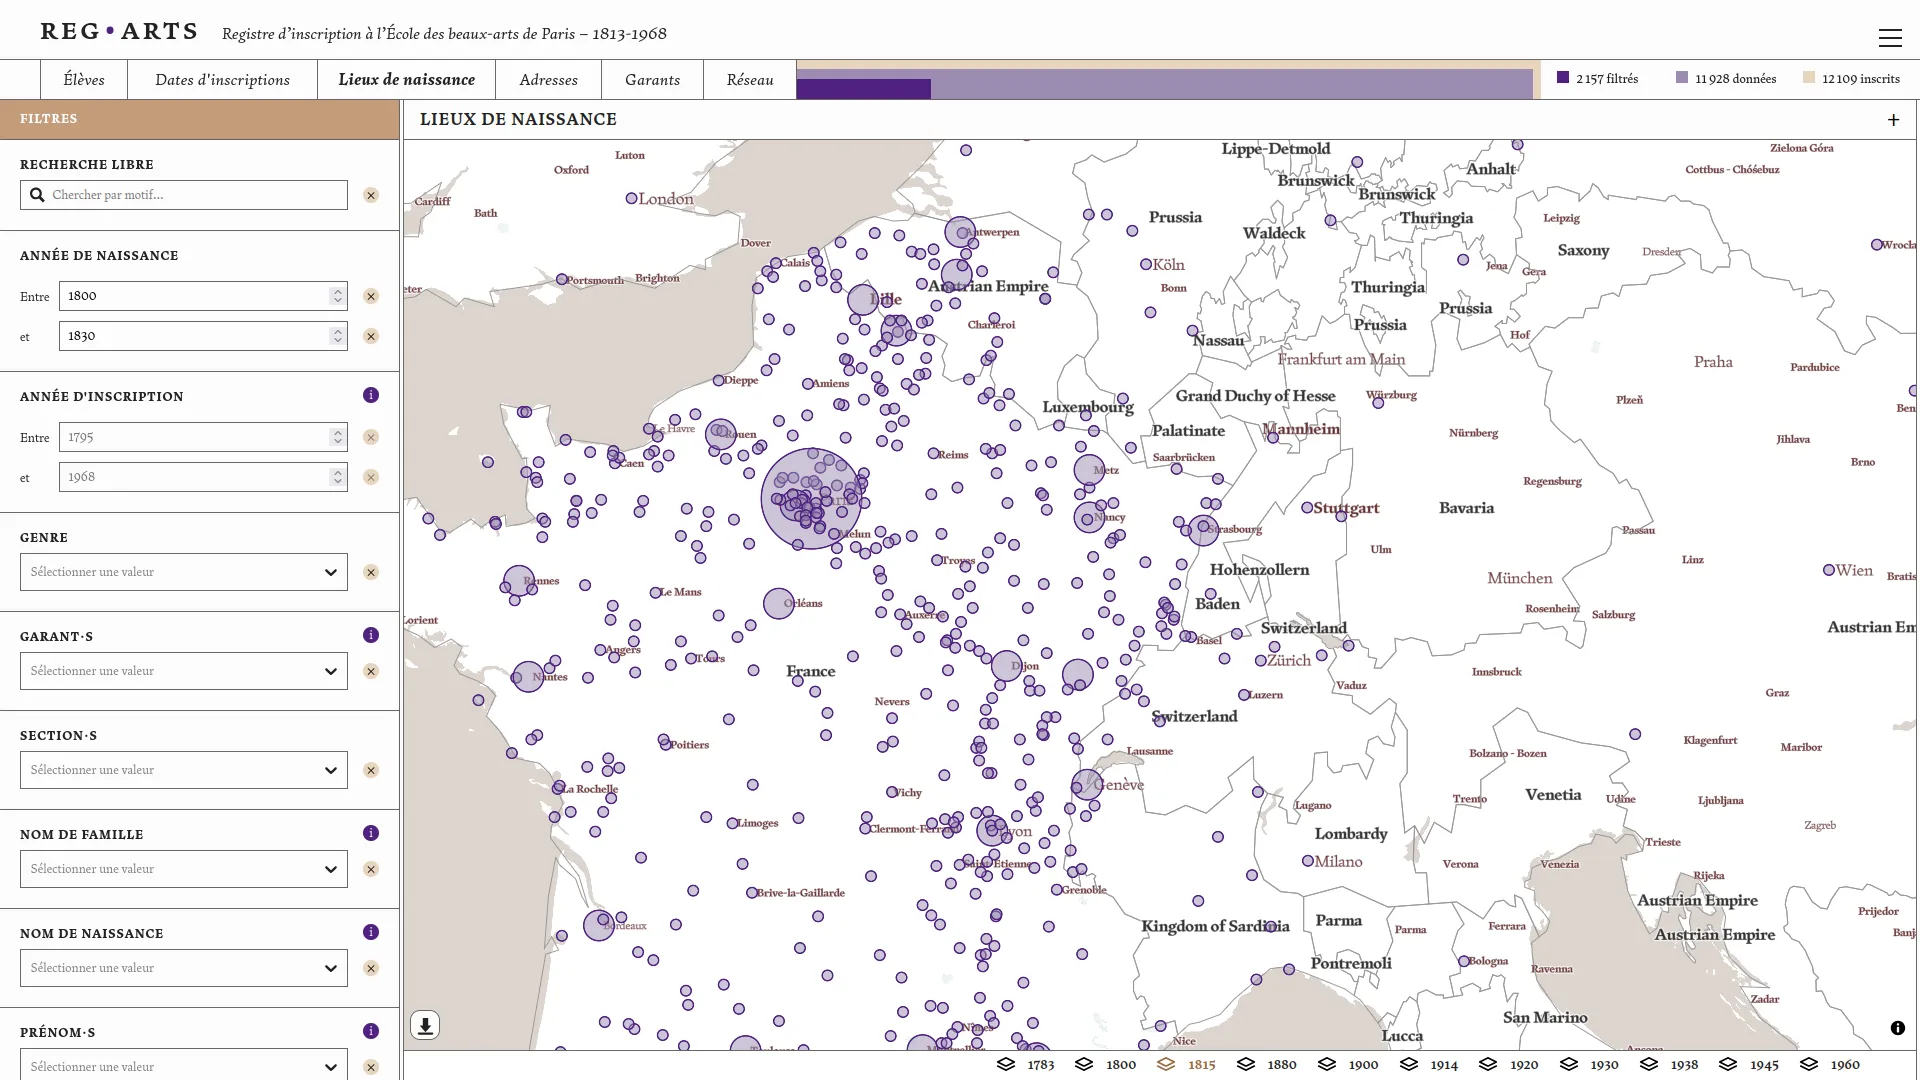
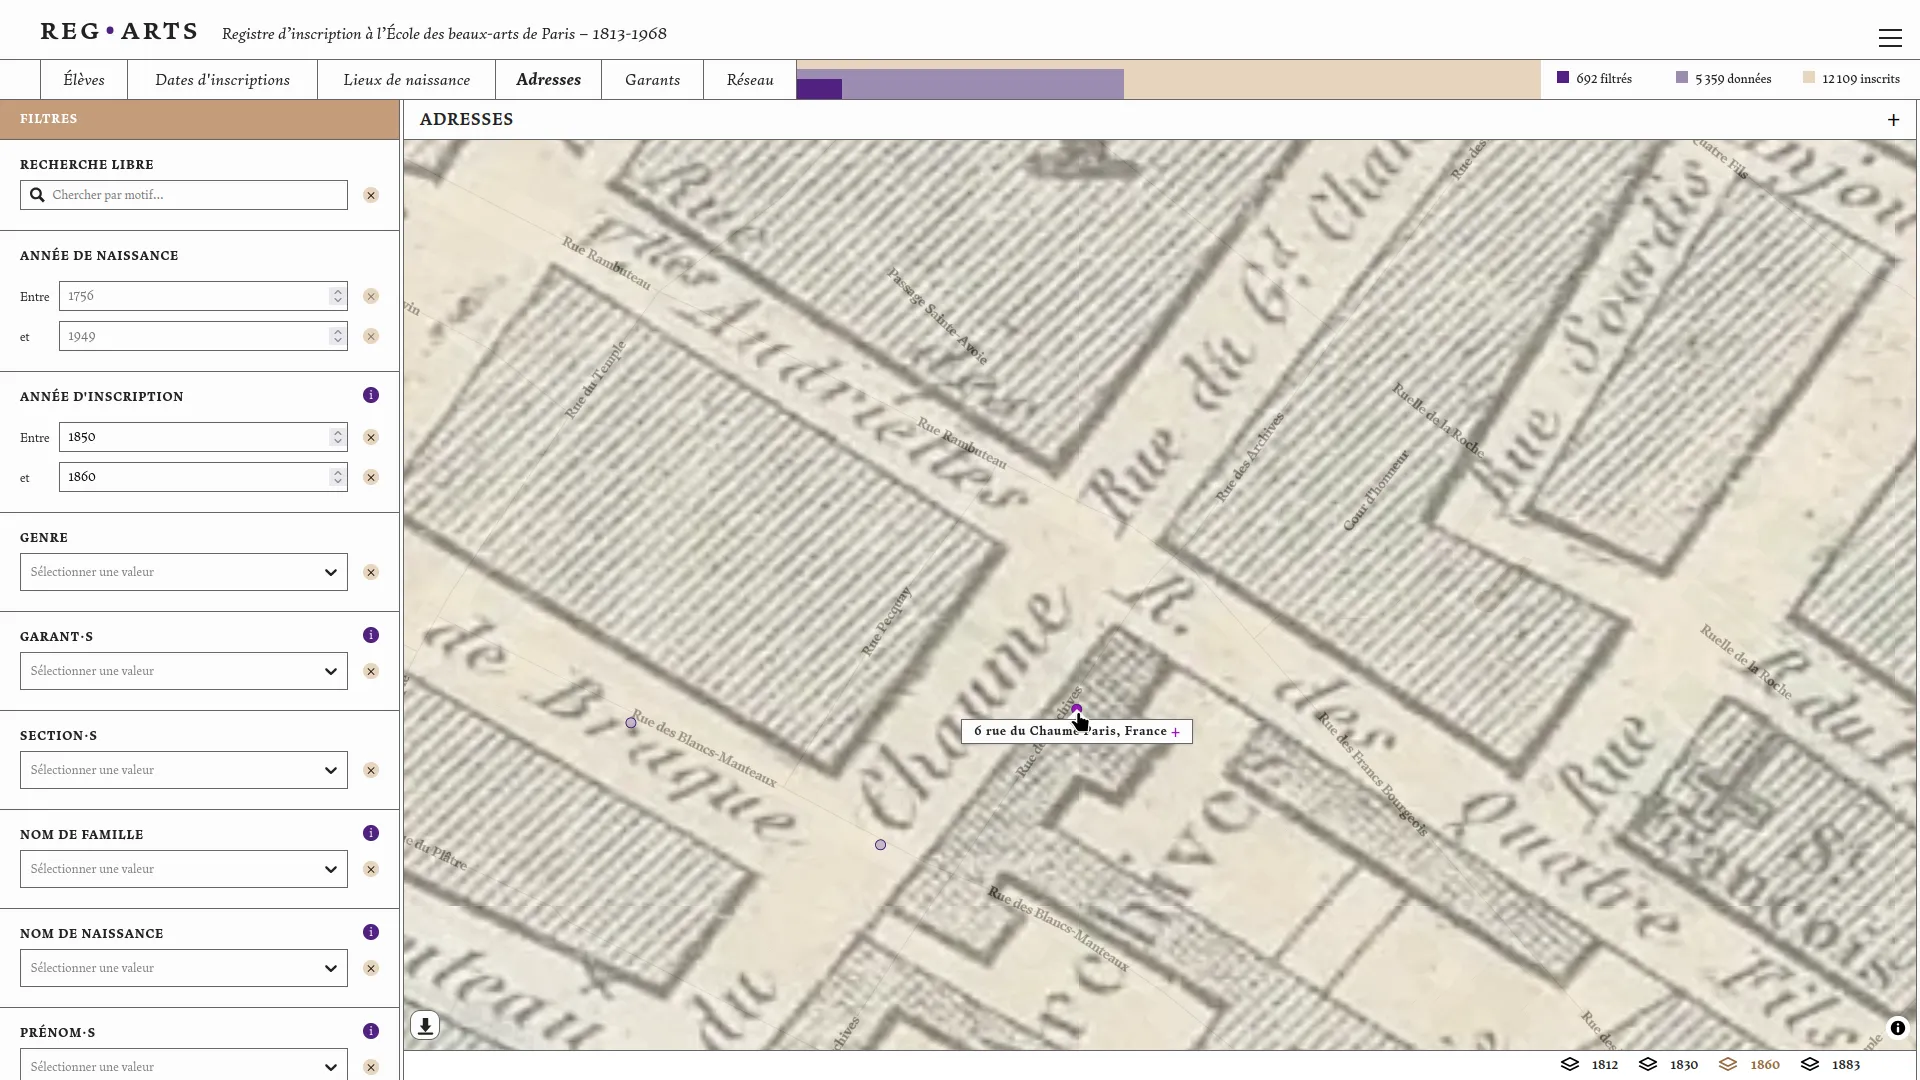


The enrollment register of the École des beaux-arts (1813-1968) consists of six volumes preserved at the Archives Nationales and the École des beaux-arts. The Reg⋅Arts project offers a digital publication of this dataset, frequently used in art history research. This publication includes an open-access dataset and an associated web application for visual exploration. The latter allows for free searches on students, places of birth, Paris addresses (1813-1892), guarantors, and also enables systematic querying of the source through search filters and their cross-referencing. It is now possible to query the registers data to extract, for example, all students born in Dijon who studied at the School between 1813 and 1840, or to see clusters forming around figures such as Jean-Léon Gérôme.
We supported the research team over several years. The first phase of our involvement was to create a structured dataset from the transcriptions. We then advised and provided tools for the normalization and alignment of the data. We ensured that the source data was preserved to allow verification of this processing. Finally we created a semantic data export in the Linked Art format.
We then co-designed and developed the web publication of this dataset in collaboration withJulie Blanc and Lola Duval. This application allows users to explore registrations over time, places of birth and residence of students, and the relationships between guarantors and students. These various visual modes are linked by a common filters system that enables the study of a specific scope within the dataset. For each student, a dedicated page brings together all the information we have related to their registration(s) at the school.
Aware of the difficulty of analyzing long-term register data, we took care to properly contextualize the visualizations and data presented. The "students" page shows the different steps that led to the normalized data: the photo of the source and the data as transcribed before normalization. Visualizations systematically indicate the number of data points not represented due to missing data. Additionally, the geographic map backgrounds were specially designed to minimize anachronism (Girard 2025). This application runs entirely in the browser, greatly simplifying its maintenance.
A Custom development project
Paul Girard, Charlotte Ribeyrol, Arnaud Dubois, Julie Blanc, and Zoé L'EVEQUE
Lisbon, Portugal
![[object Object]](/_astro/narrative_page.DNVwQoY6_91YVn.webp)
The “Persoz, the birth of heritage sciences and medieval colours” narrative page with “Jean-François Persoz” marker and notice link highlighted.
![[object Object]](/_astro/colourwheel.D5HuUlH4_1H4ojx.webp)
The object "Register of samples and correspondence, 1850-1930: letter from Camille Koechlin to Horace Koechlin, 4 August 1861" in the colour wheel page.
![[object Object]](/_astro/IIIF_viz.157K4vUZ_FcpKu.webp)
A IIIF viewer in the Azofuchsine 6B Bayer, CNAM Musée des Arts et Métiers, Paris object page.
![[object Object]](/_astro/editor_notice_link.CSaAjxfG_Z2bKWdK.webp)
![[object Object]](/_astro/editor_wikidata_import.C2CIKpNB_Z223lcc.webp)


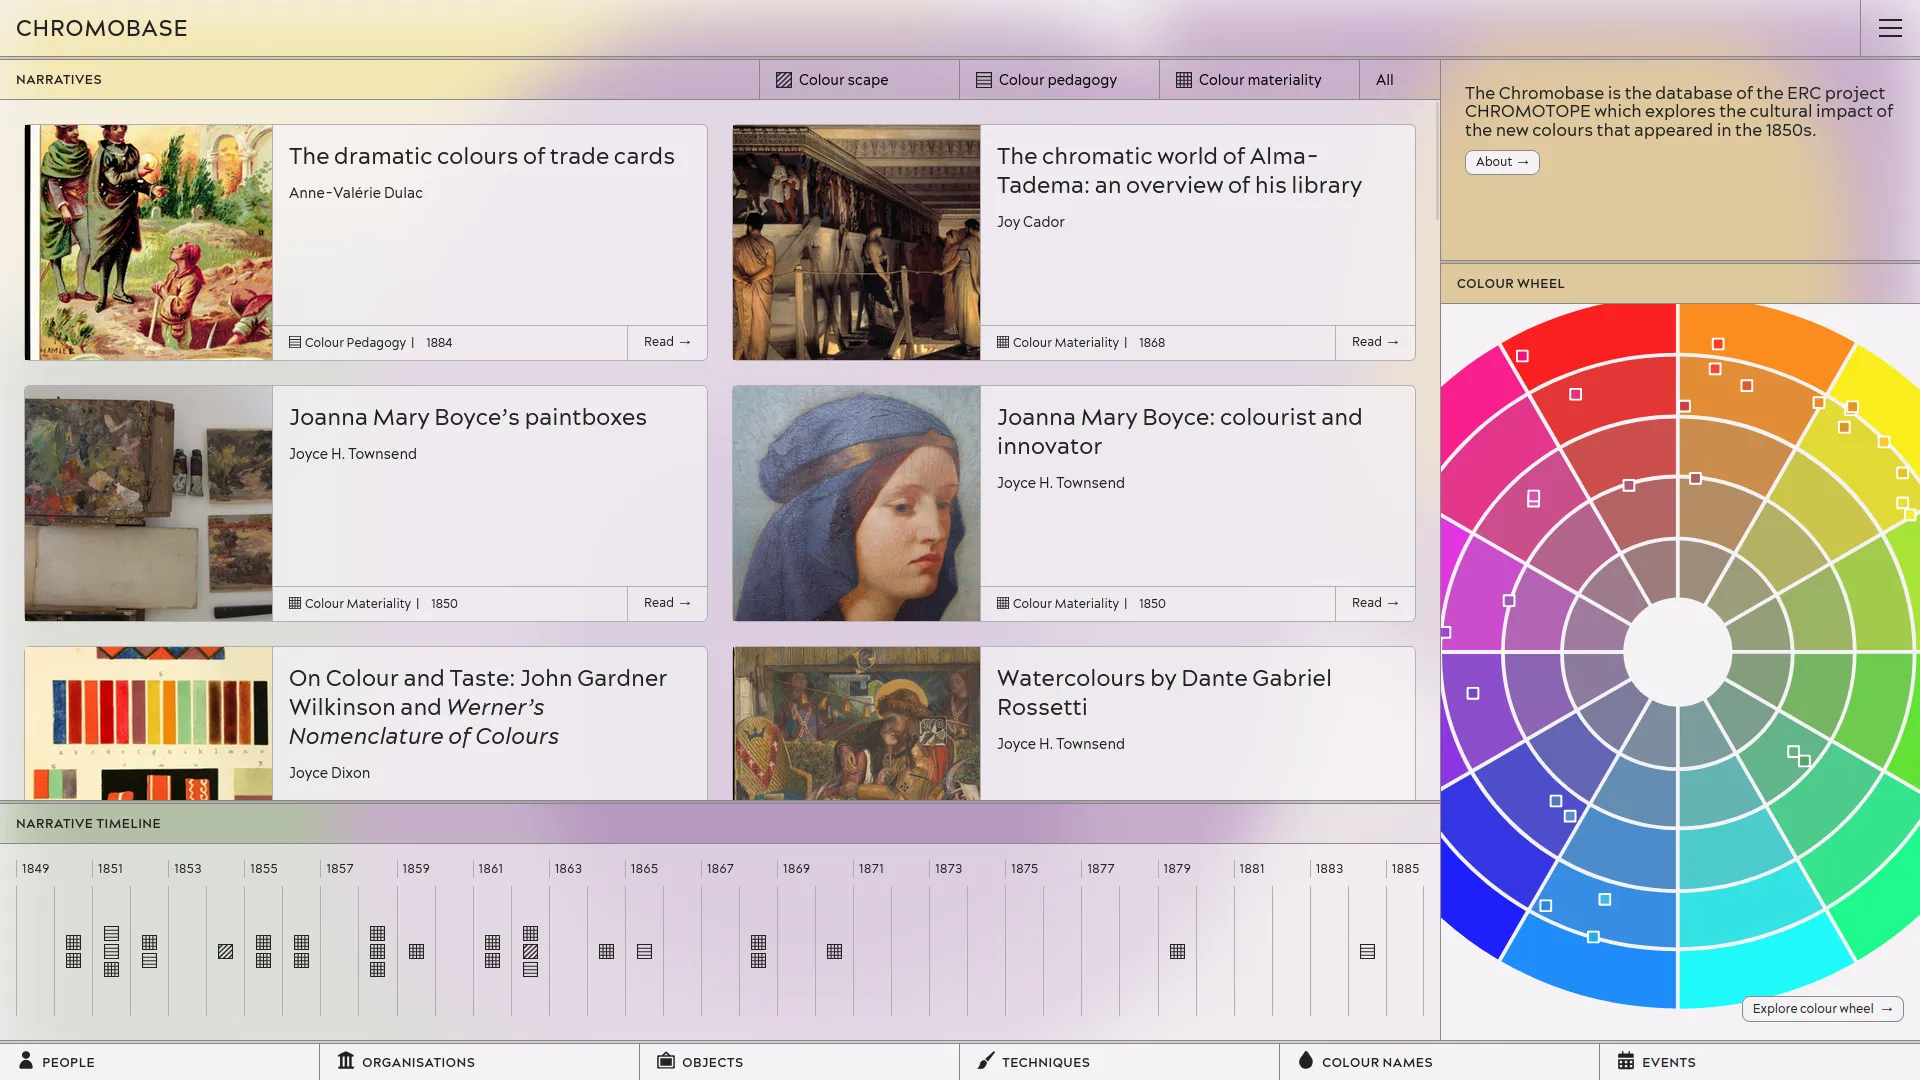
The Chromobase is the open access database produced by CHROMOTOPE, an ERC funded project led by Charlotte Ribeyrol. This research program explores what happened to colour across industrial Europe in the second half of the 19th century. The Chromobase depicts how the new colouring materials and techniques which were invented in the 1850s brought about new ways of thinking about colour in literature, art, and the history of science and technology. The extraordinary story of this 19th century “Colour Revolution” is told through a series of interwoven interdisciplinary “narratives” written by colour experts from all over the world.
We developed a narrative-driven methodology where texts written by researchers are the source from which data points are created. The editorial process annotates the texts provided by scholars linking entities such as people, organizations, objects, techniques, events, colours or references. Each edited piece adds one layer of data points into our dataset, forming little by little a comprehensive set of (human and non-human) actors who played a role in our object of study. Each author decides which specific items to highlight by talking about it in their narrative. Thus all data points are by-design curated and contextualised by texts which can be referenced to, to learn more on their roles and interactions.
To fuel that process, we developed a custom CMS based on Keystone.js including dedicated features such as text editor with notice linking, a wikidata data import module or a High-Definition picture upload format which uses the bIIIF IIIF tiles generator. The database is then transformed as a static website by using Astro. This website has been designed by Julie Blanc to propose visual interactive interfaces which fosters serendipity and unveils the 19th-century colour materiality
A Custom development project

G.V() is a graph database exploration platform, designed with web technologies, notably sigma.js.
We support them in enhancing and optimizing their sigma.js integration. Furthermore, the G.V() team regularly sponsors us to develop new open-source features, as well as to debug and optimize the sigma.js codebase.
A Consulting and support project
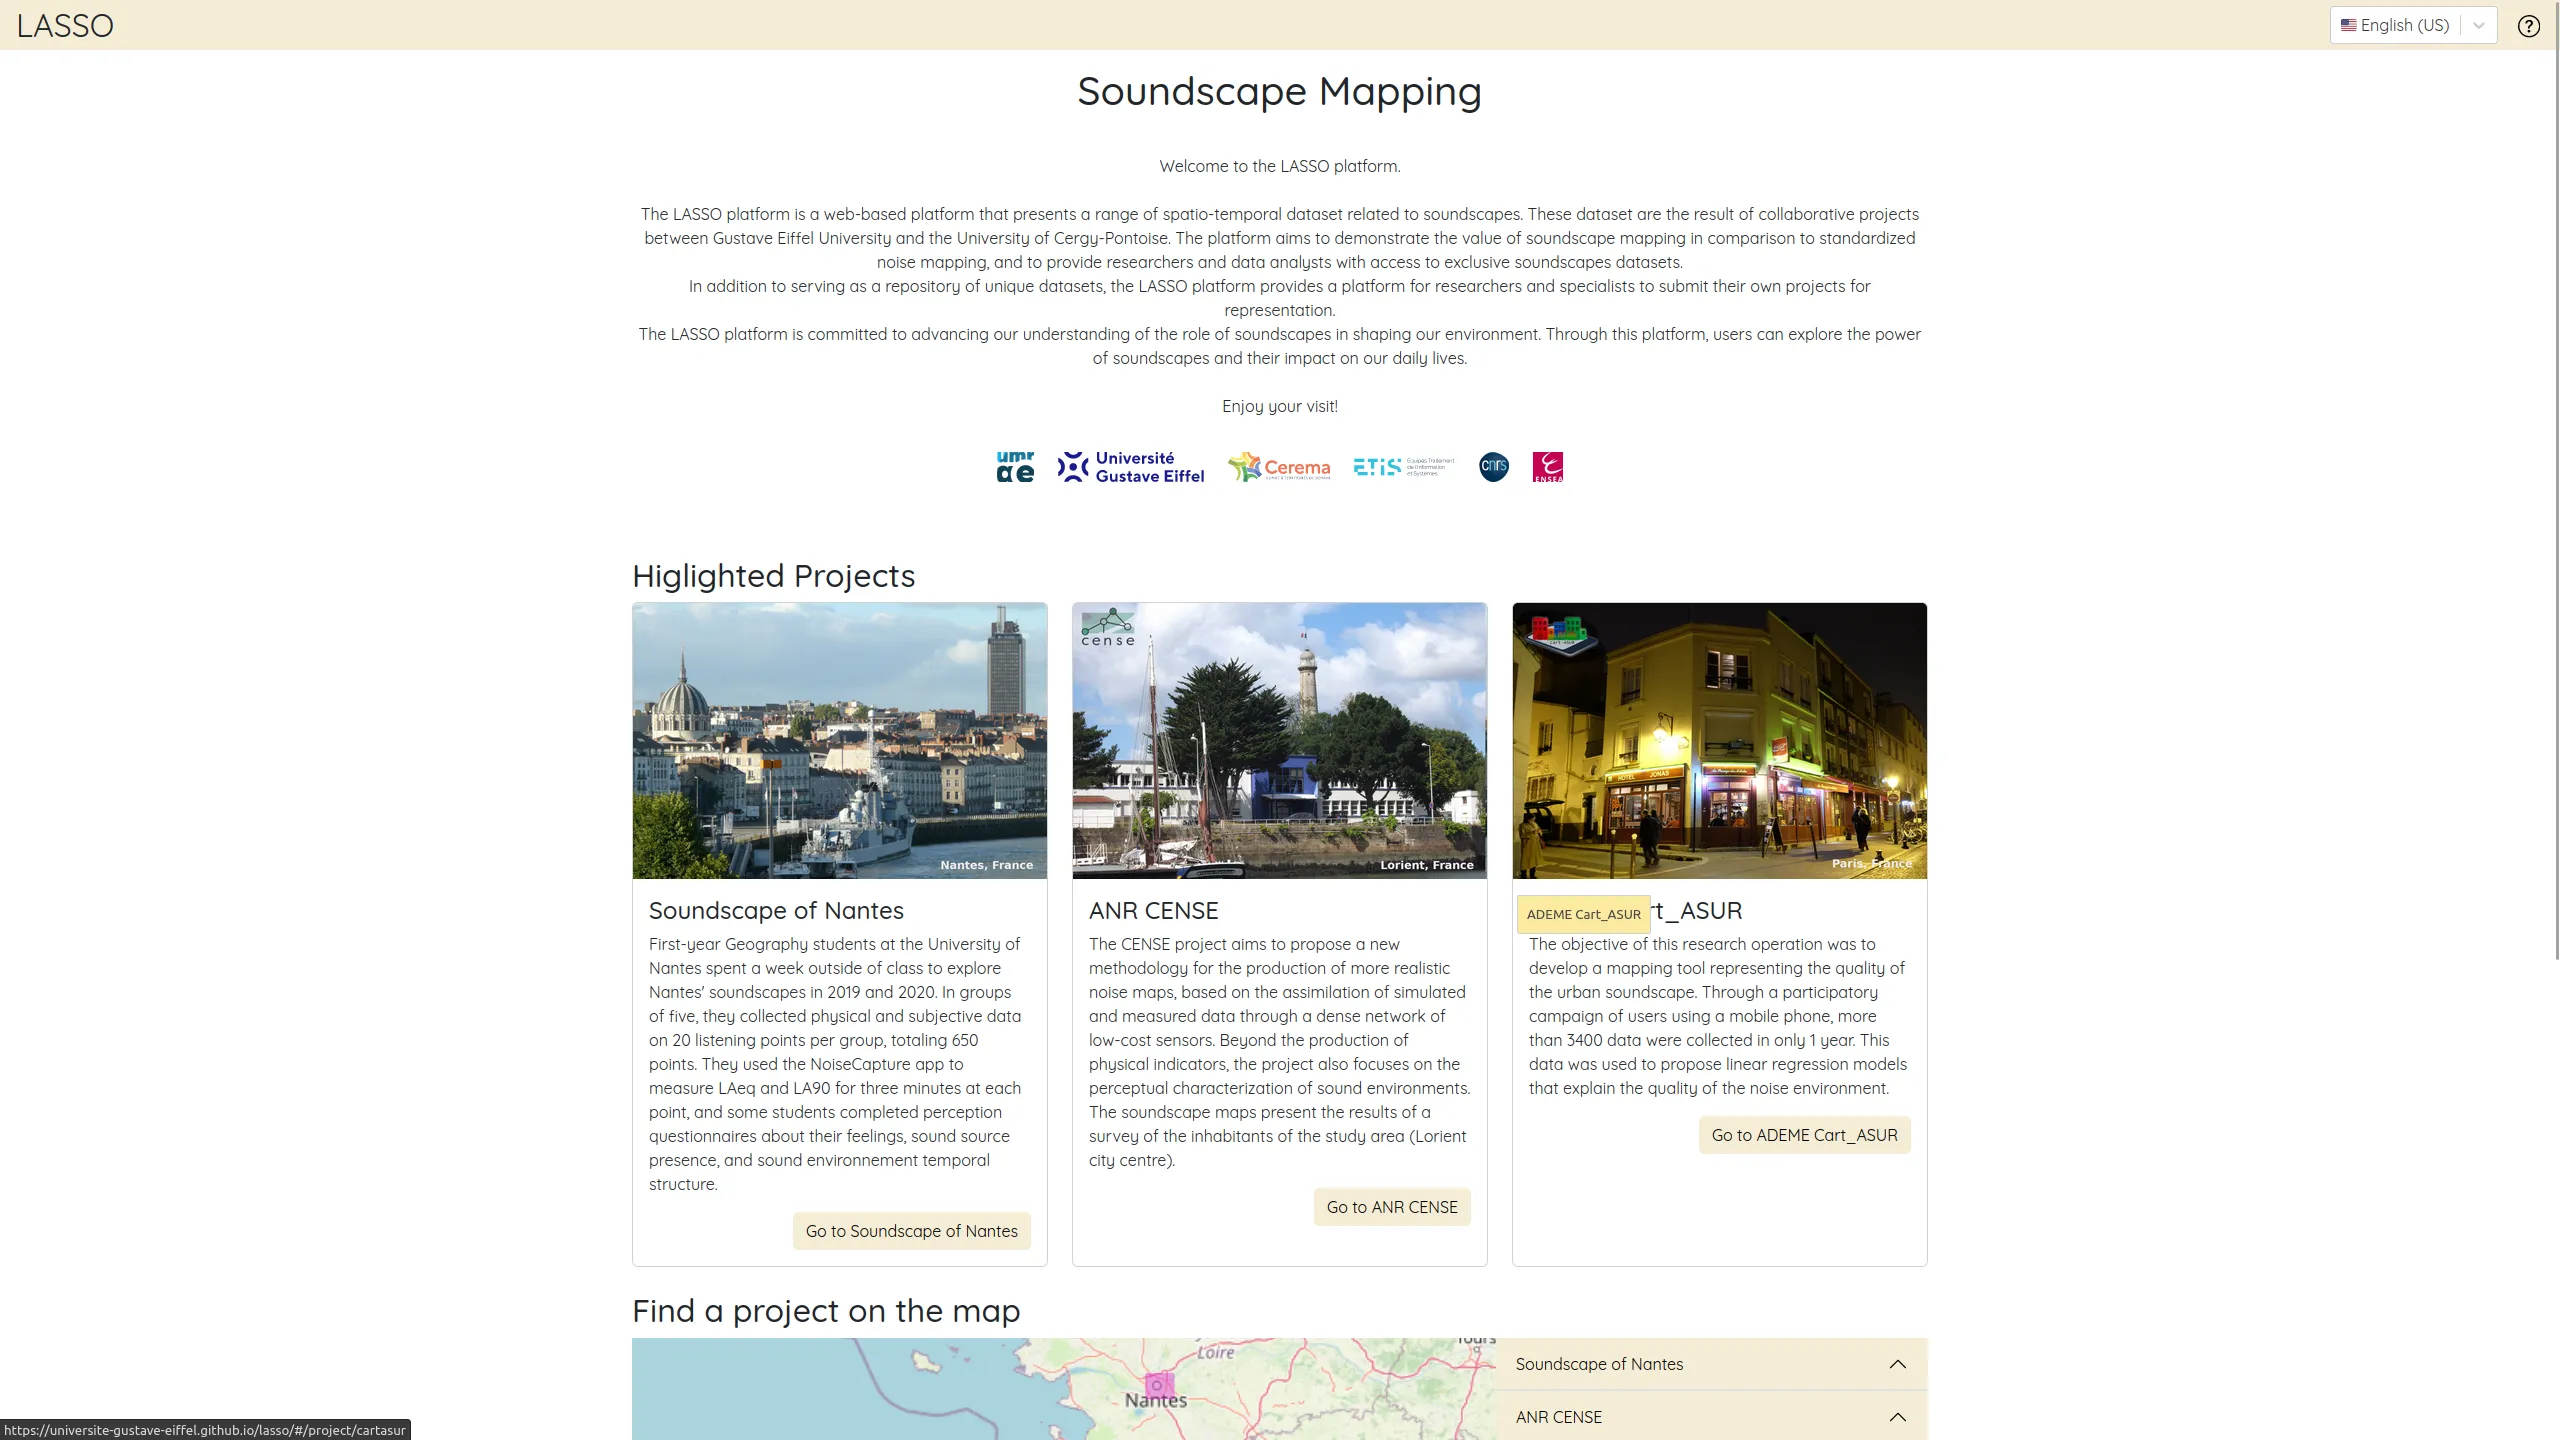
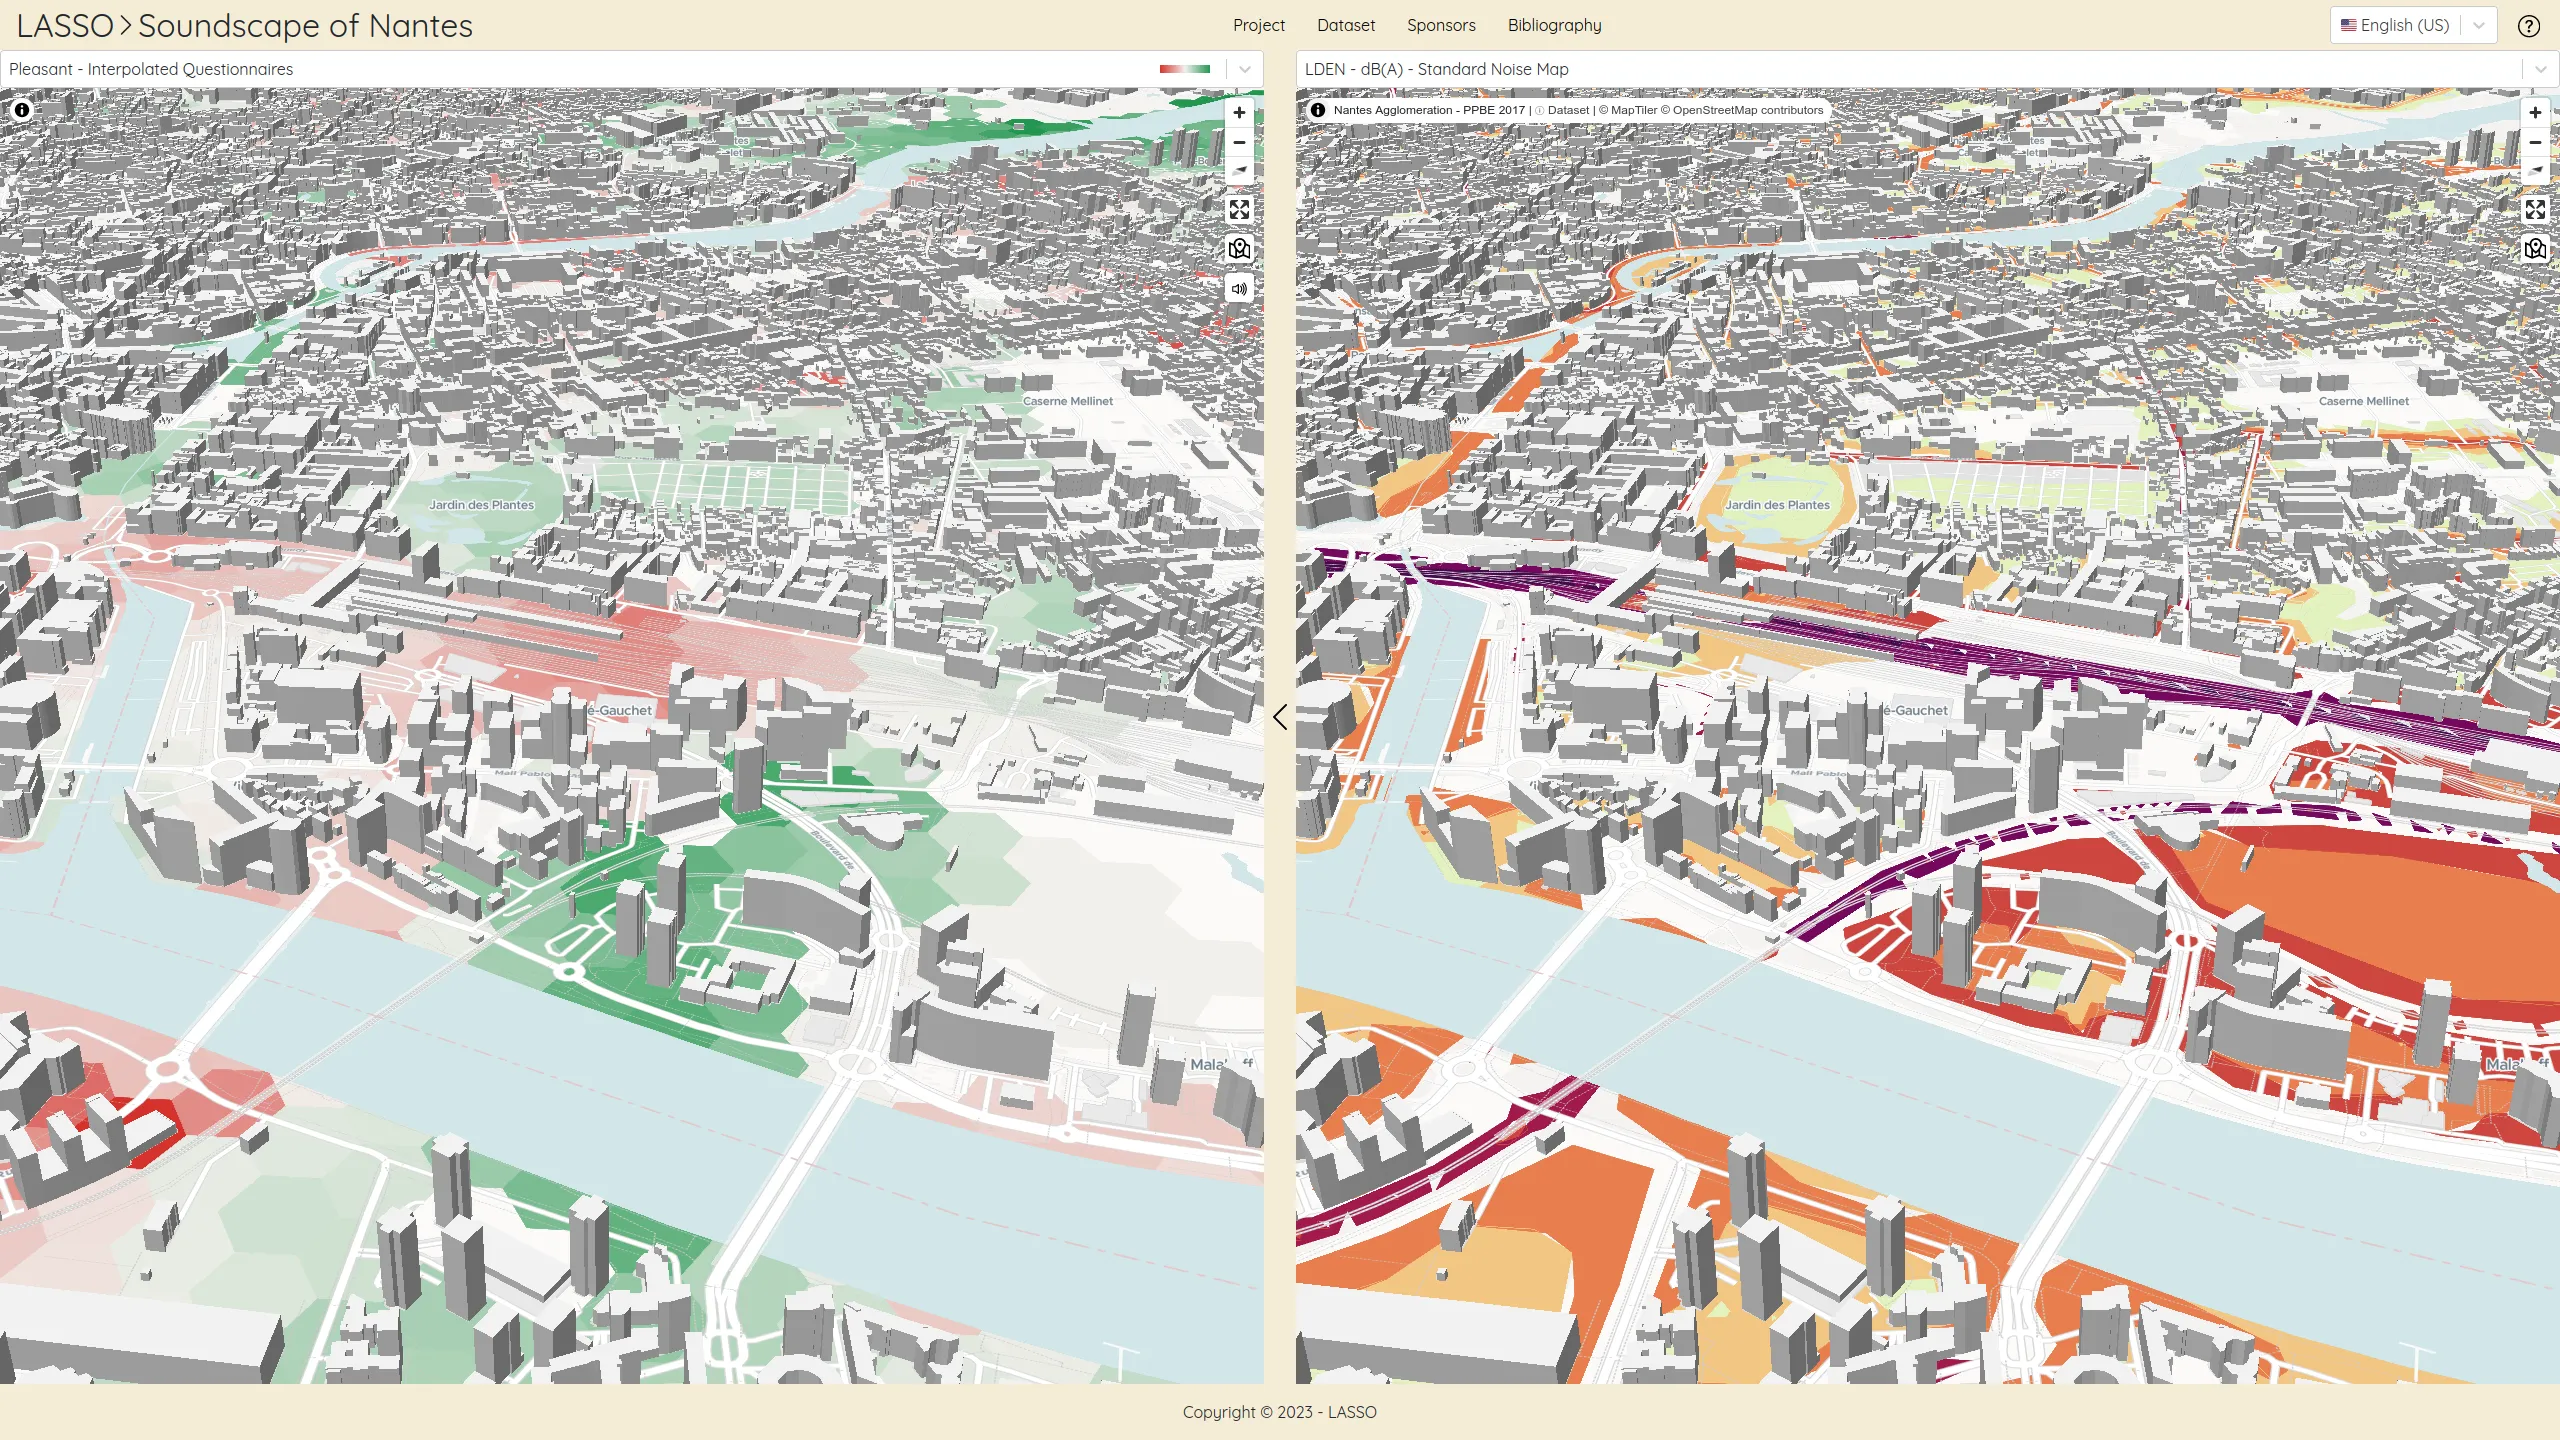
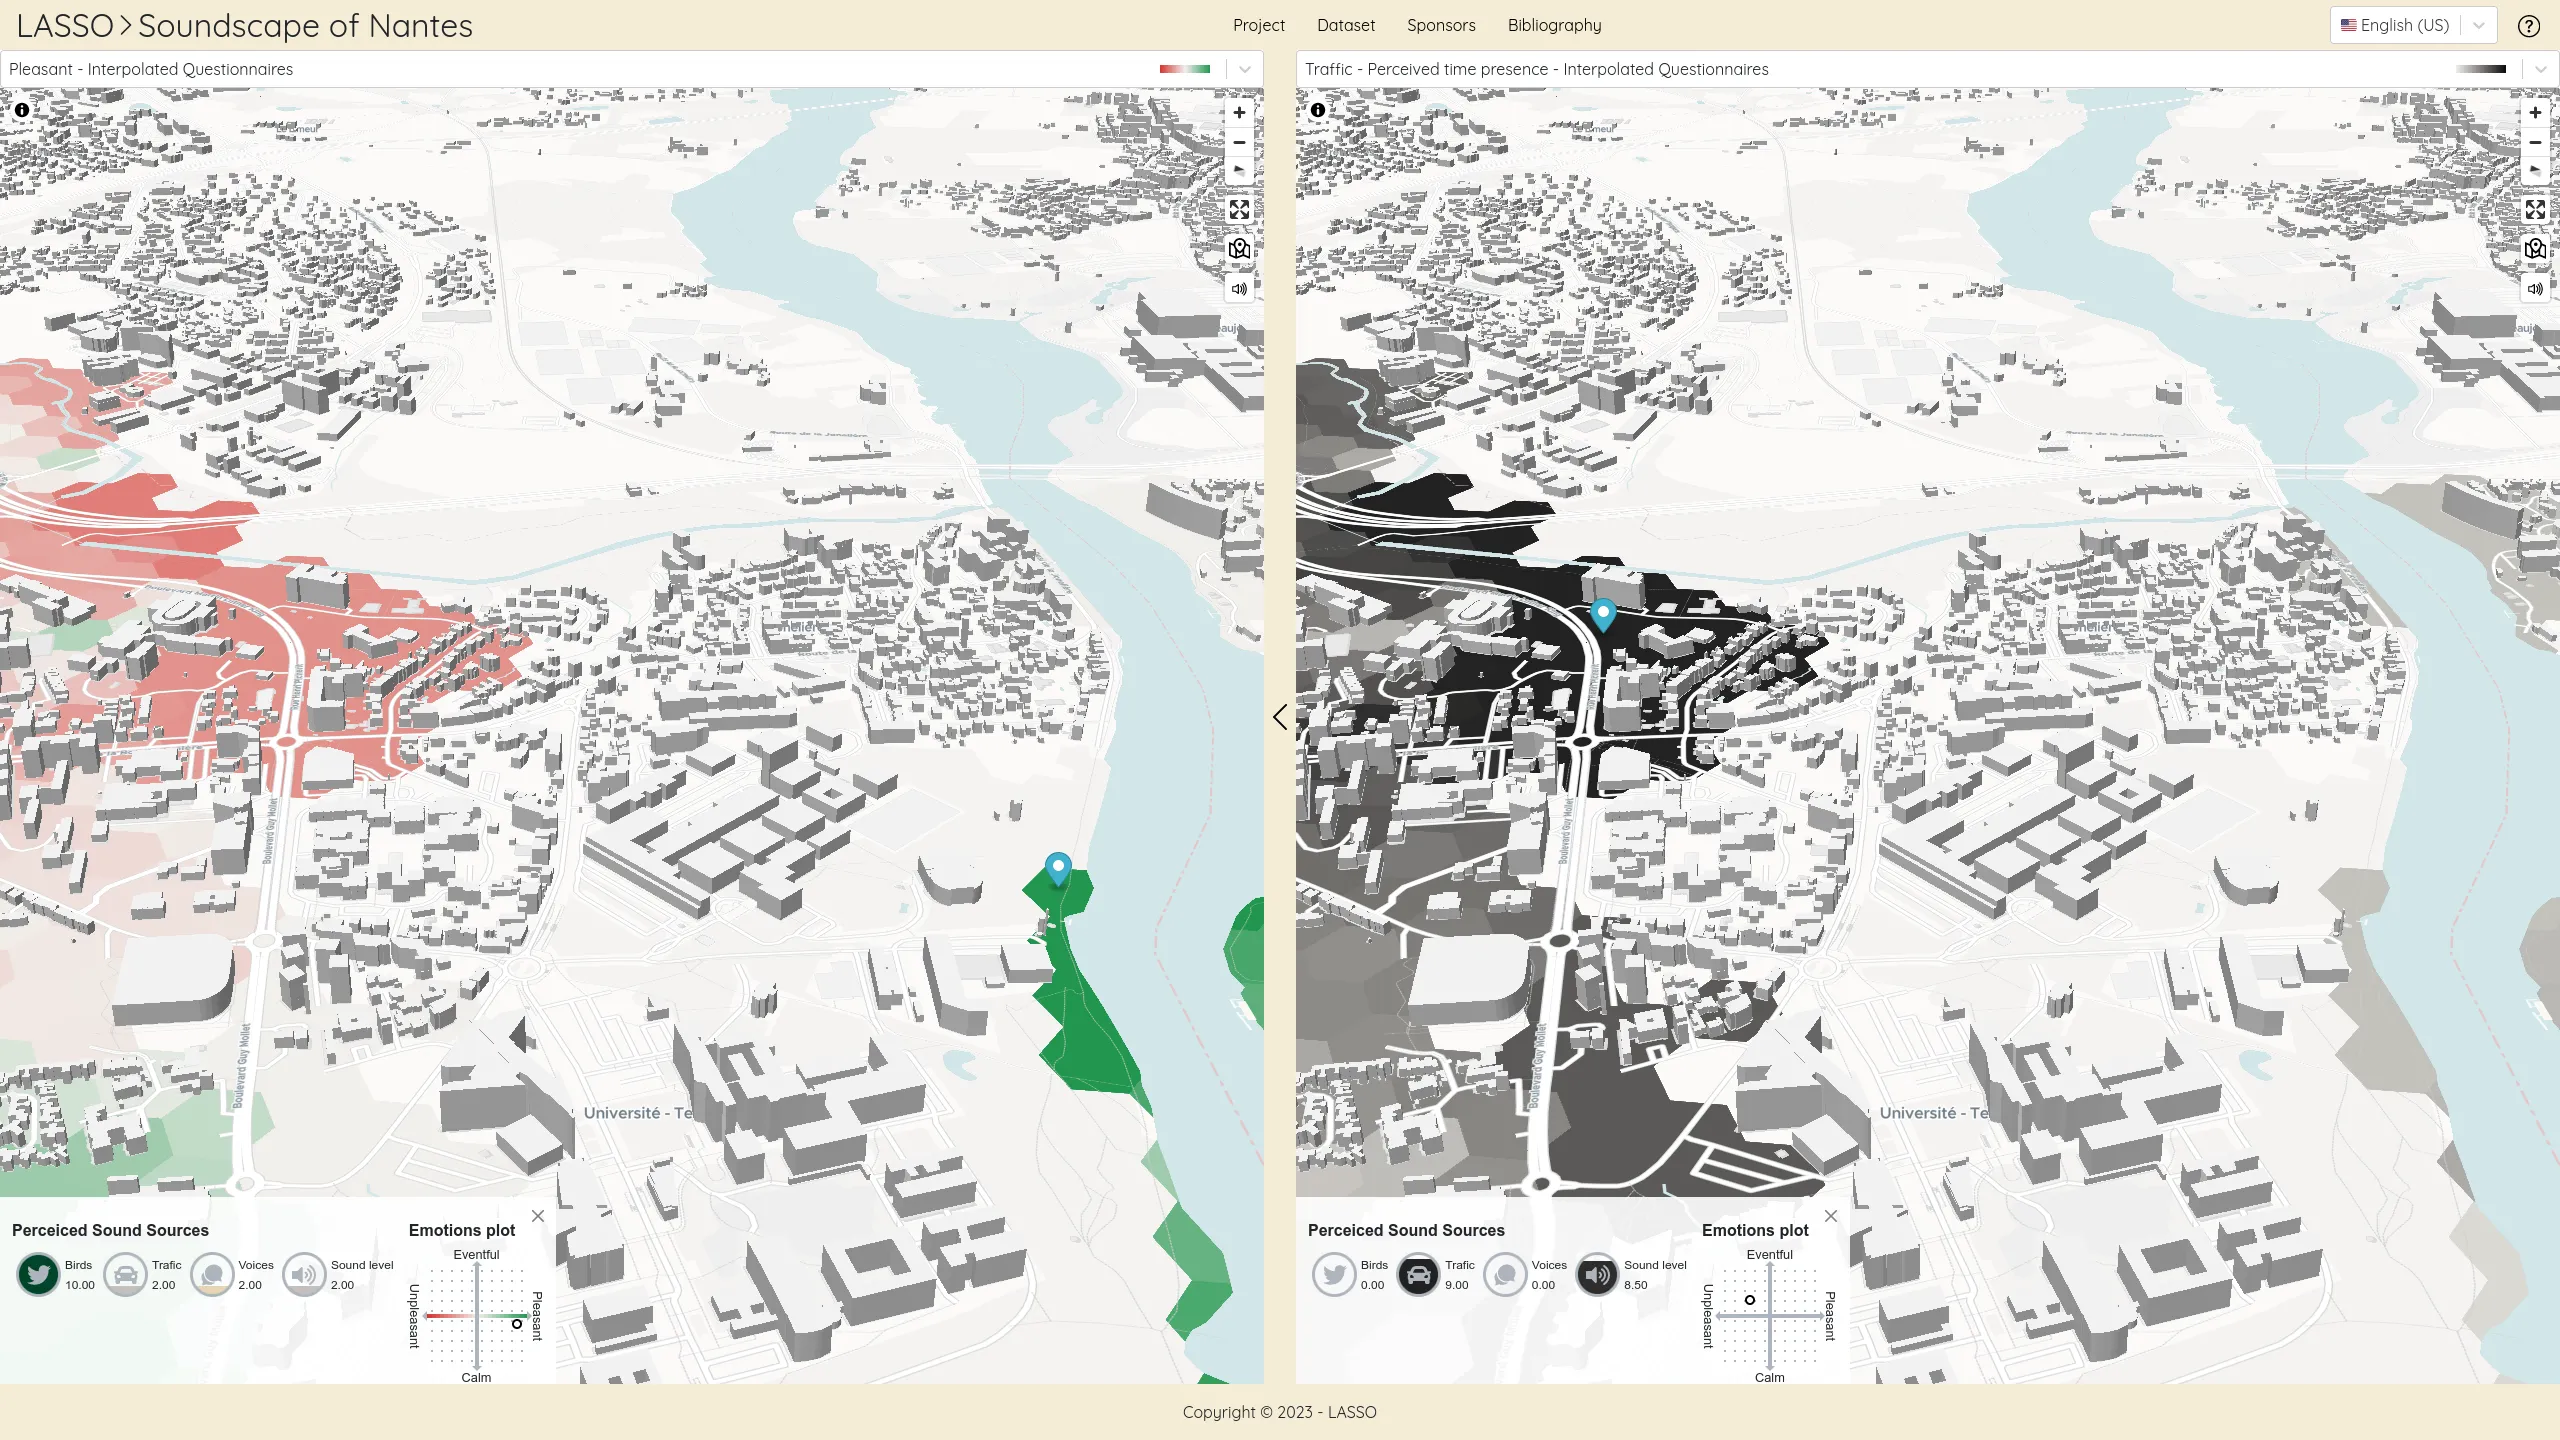


The LASSO platform is a web-based platform that presents a range of spatio-temporal dataset related to soundscapes. These dataset are the result of collaborative projects between Gustave Eiffel University and the University of Cergy-Pontoise. The platform aims to demonstrate the value of soundscape mapping in comparison to standardized noise mapping, and to provide researchers and data analysts with access to exclusive soundscapes datasets.
In addition to serving as a repository of unique datasets, the LASSO platform is committed to advancing our understanding of the role of soundscapes in shaping our environment.
We designed and developed this platform as a serverless react application powering advanced vector tile cartography thanks to MapLibre.
A Data valorization project
With the people from the Sciences-Po médialab, we are meeting for a few days in Nantes to finalize version 2.0 of sigma.js. We are also taking the opportunity to completely redo the website and the code examples.
Nantes, France
Alexis Jacomy
Brussels, Belgium
The first sigma.js version based on Graphology.
OuestWare and Sciences-Po médialab
The "official" library to use sigma.js within React based applications.
Benoit Simard

Improving and maintaining an open source JavaScript library
We develop and maintain sigma.js, an open source JavaScript library dedicated to drawing networks. We use this library in many of our projects.
We can develop specific business features on demand, or more generic open-source features when possible. We also maintain React Sigma, that makes it easier to use sigma.js in React-based applications.
A Open Source and Open Data project
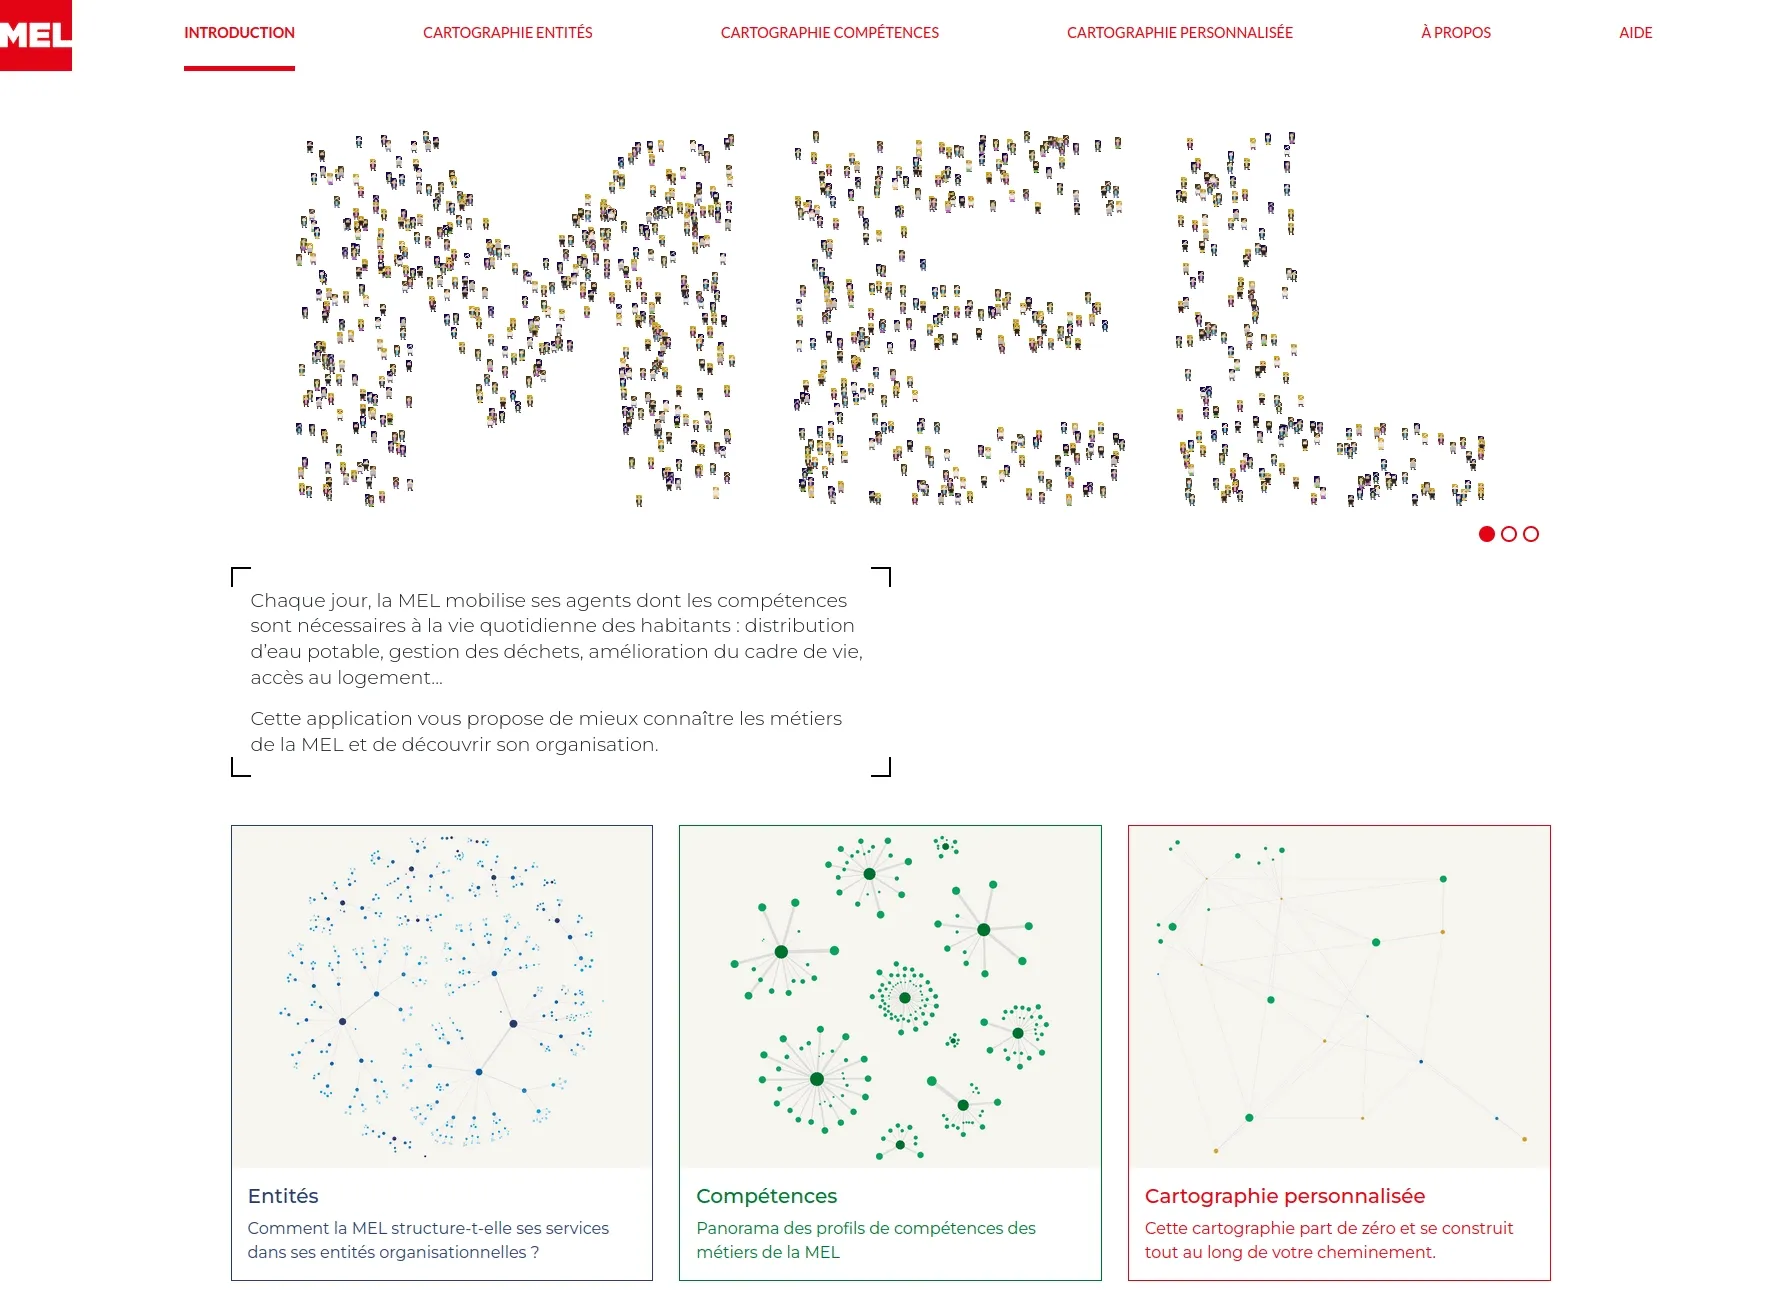
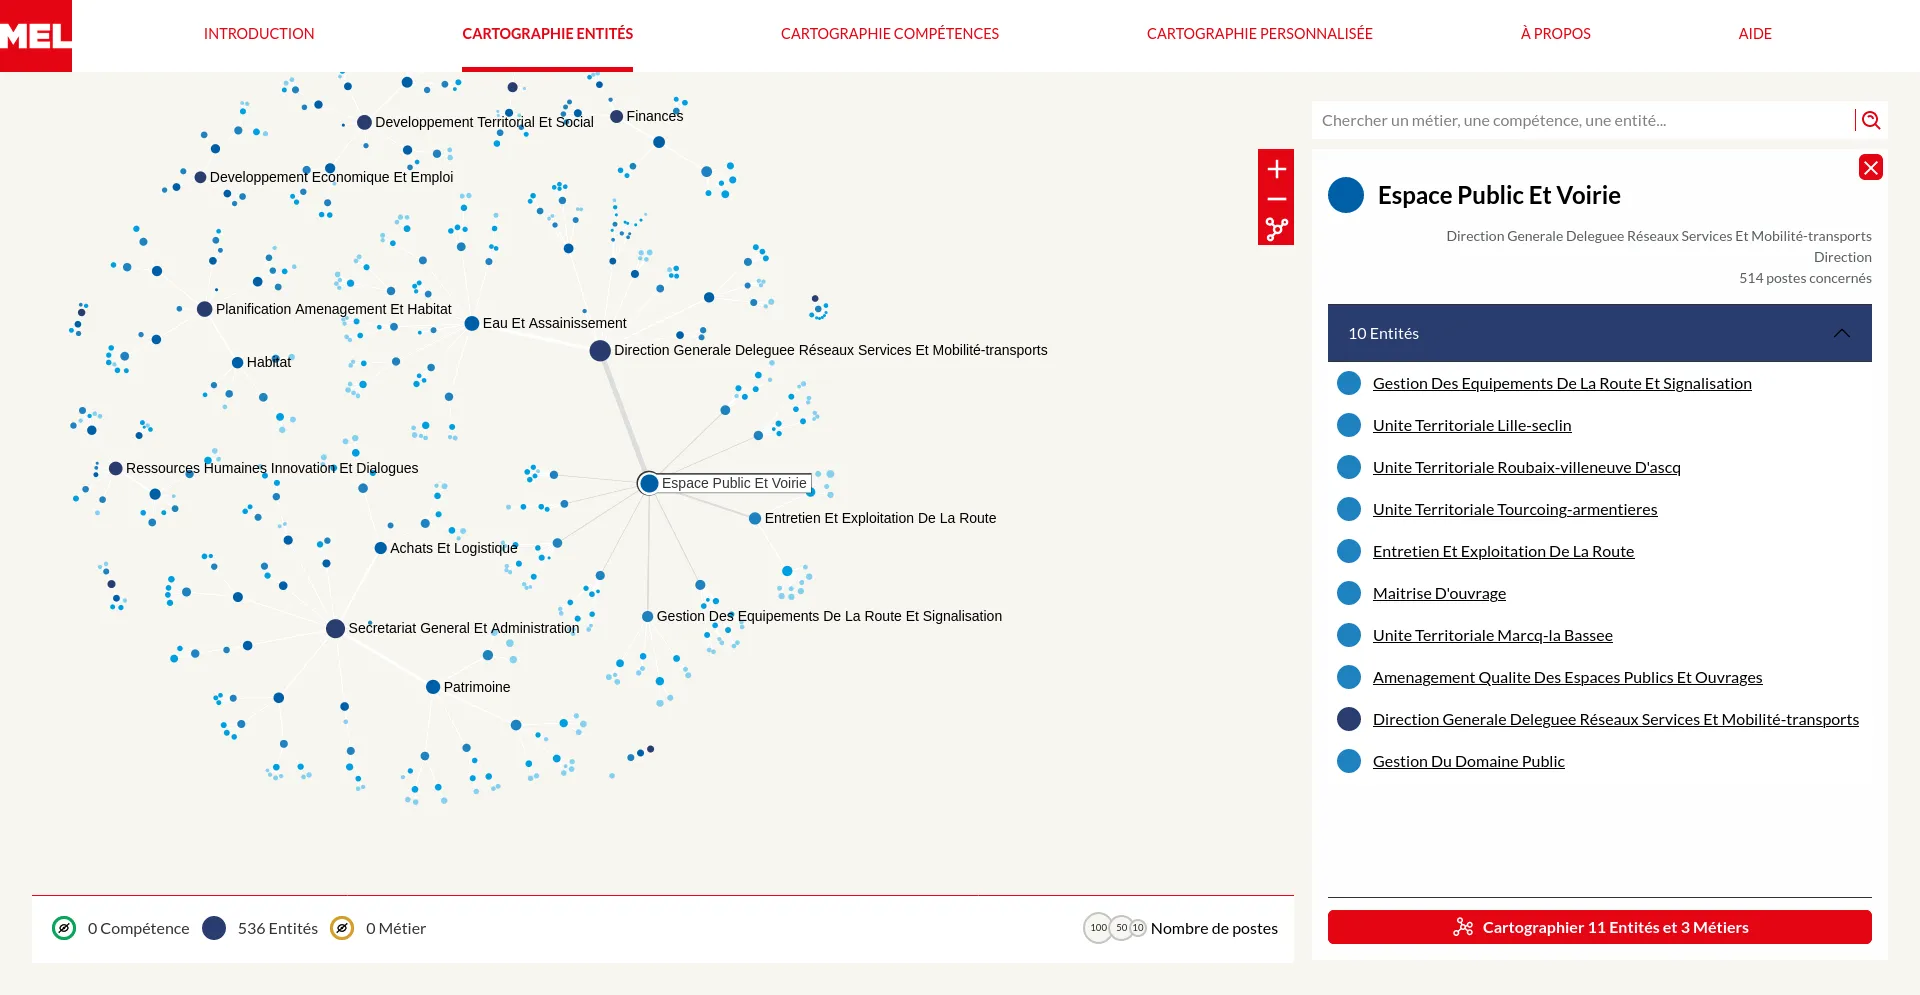
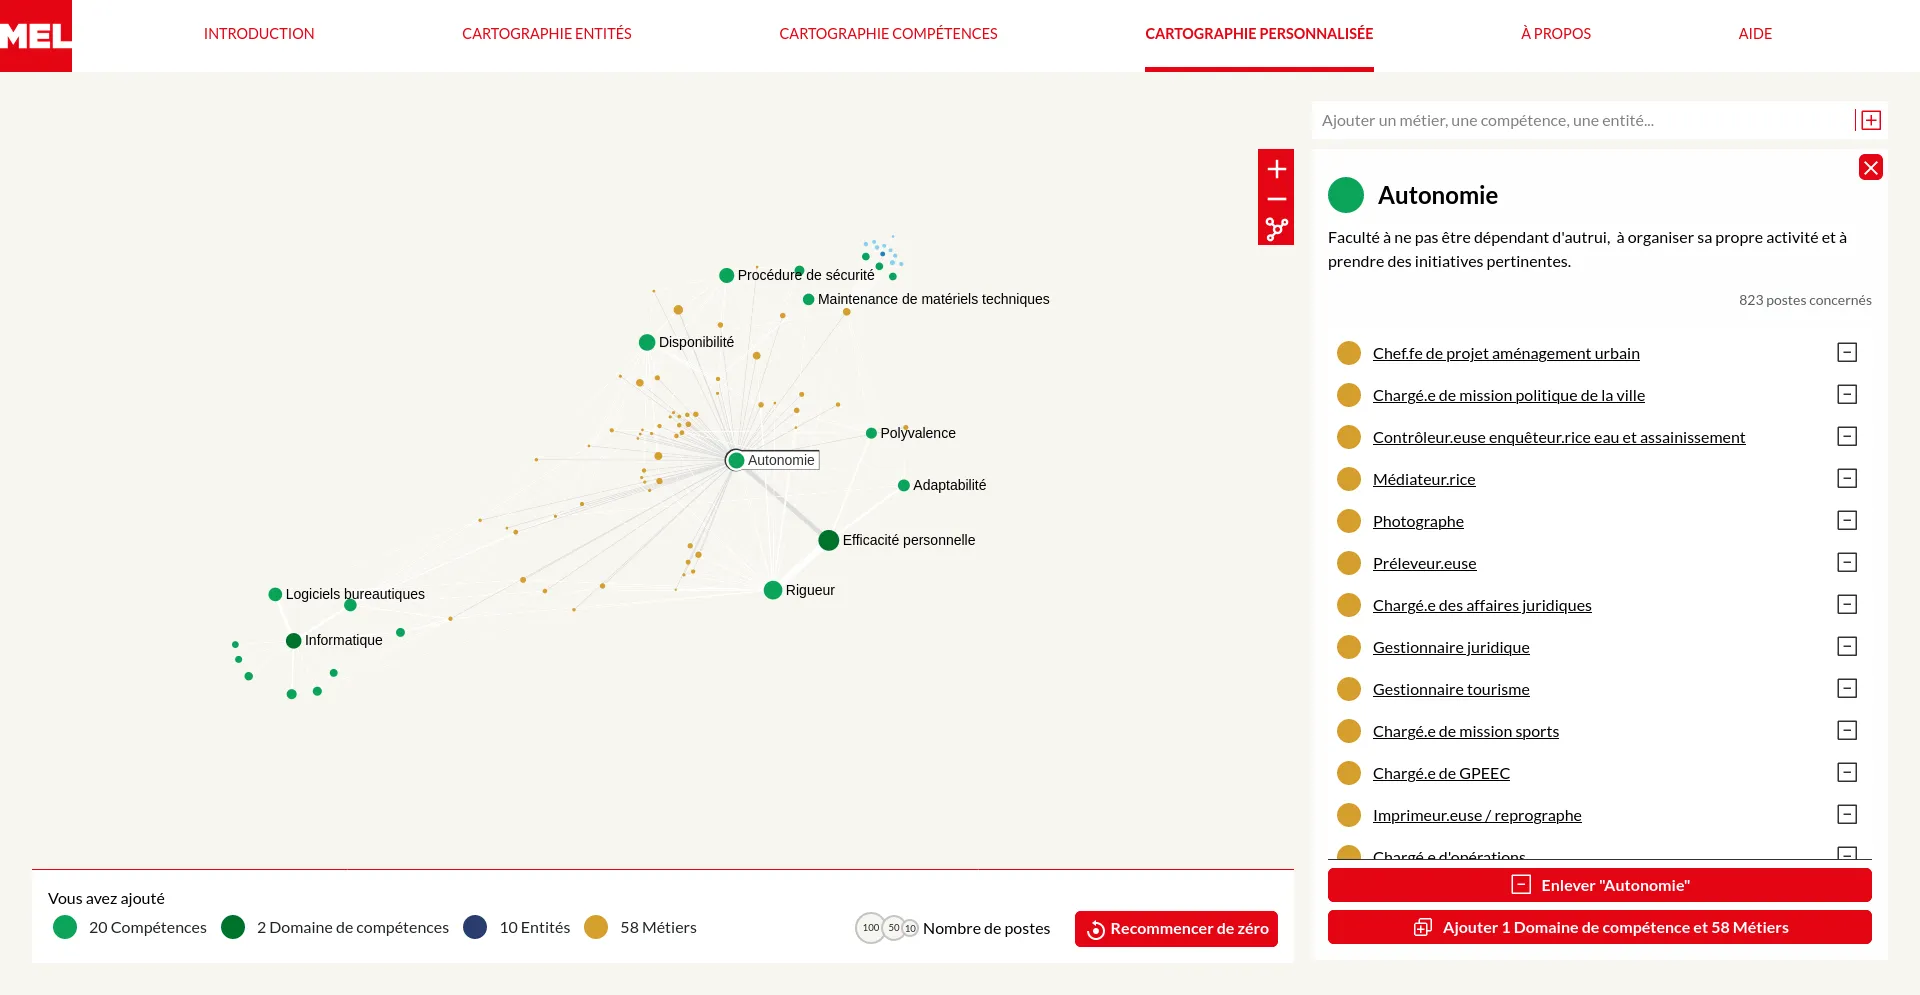
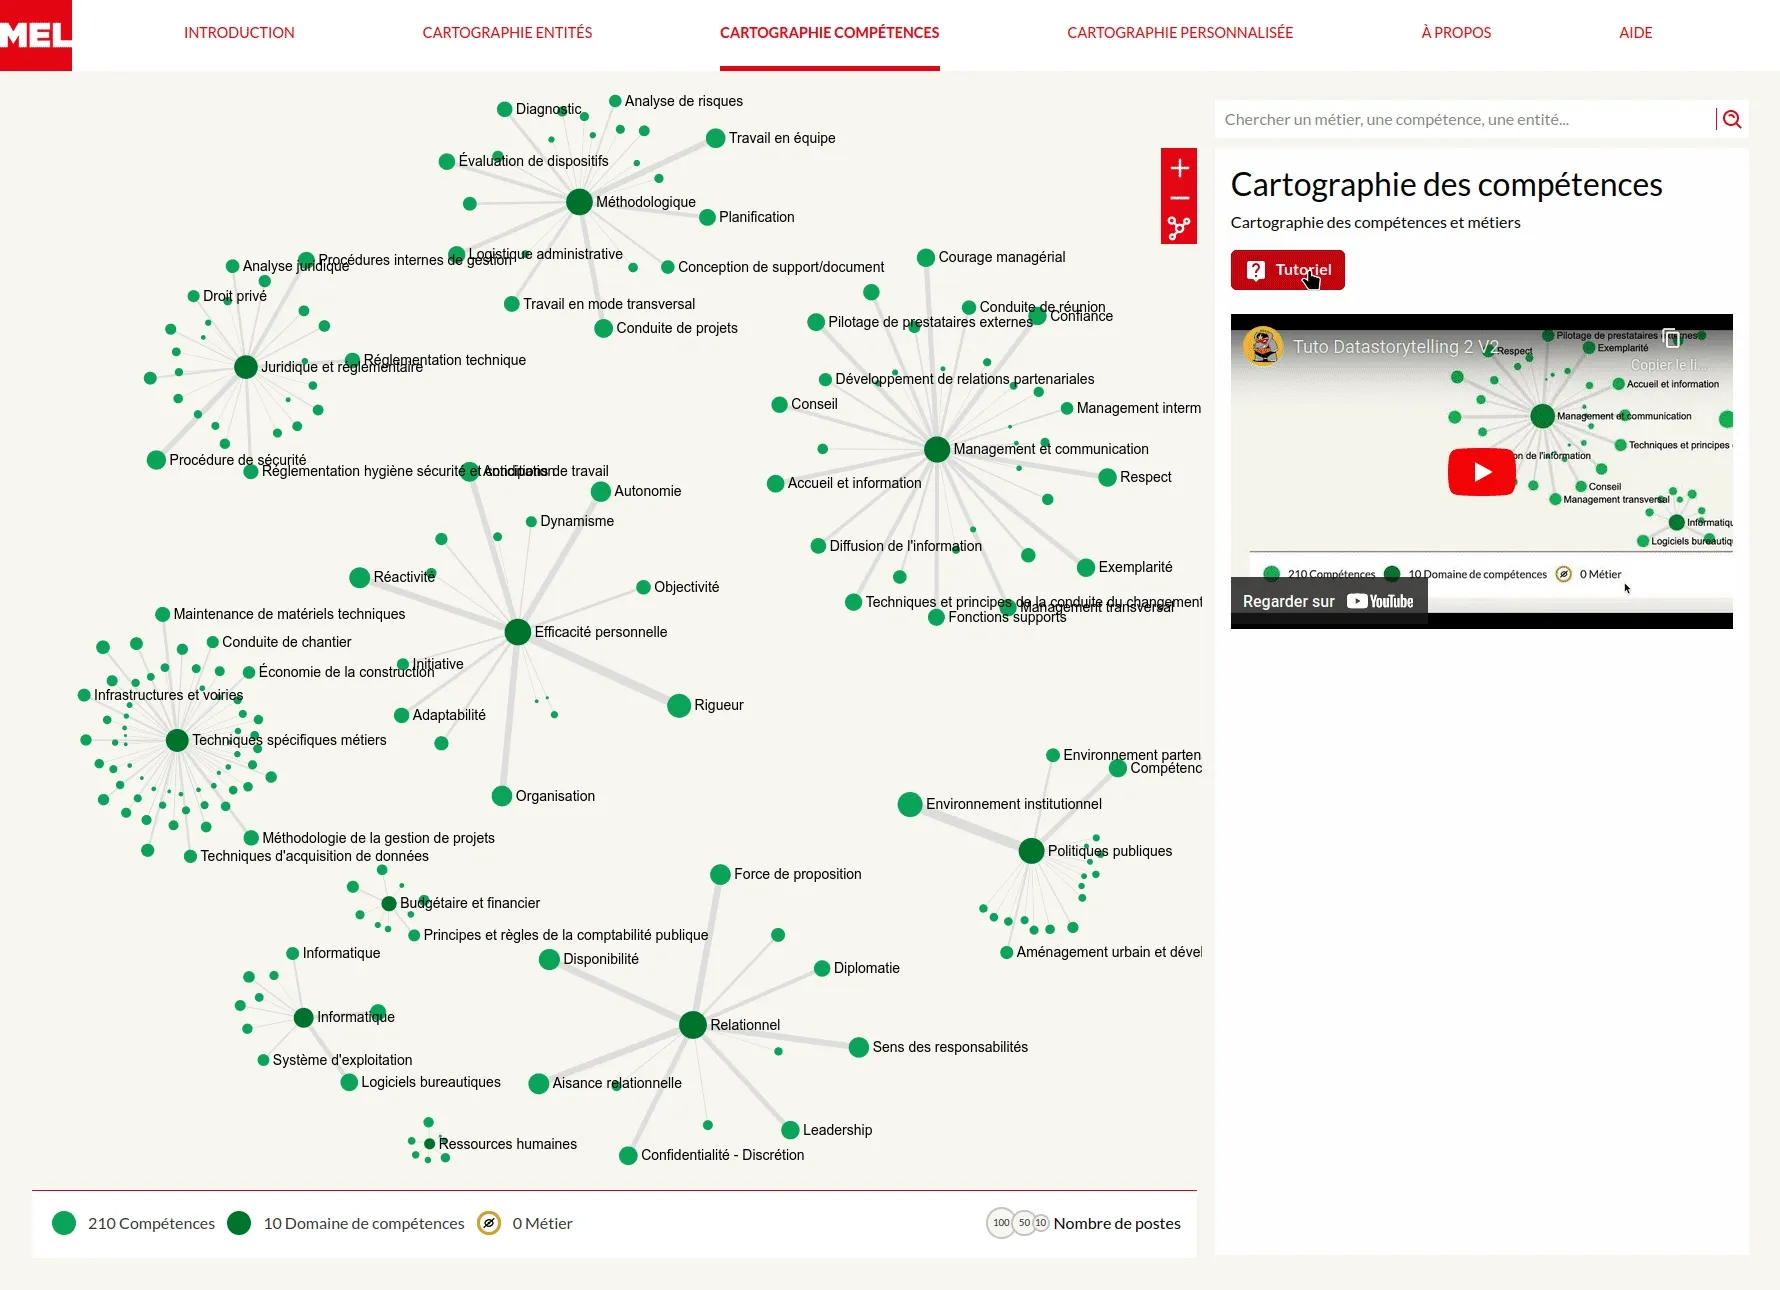


The Métropole Européenne de Lille (MEL) provides public services thanks to many collaborators, whose occupations are numerous from gardeners to accounting. In collaboration with the Datactivist team, we designed and developed a series of visual exploration tools to dive into the professional landscapes of this large public administration.
Our goals: reveal the many departments, occupations and skills which compose the MEL working community. For external people who might consider joining the organisation, or for internal collaborators who would like to better understand the bigger picture or identify possible future career paths.
To meet those objectives, we designed two complementary exploration modes: draw the whole or build a custom small scale map from precised interests. In both cases, we made sure to guide users into their visual explorations by introducing our applications with rich interactive guided tours and by contextualizing them with a textual navigation panel.
A Data valorization project
This entirely revamped beta version of GraphCommons took more than a year to develop.
A new version with server-side rendering, which improves, among other things, search engine optimization.

Since 2021, we have been developing and maintaining the web platform for GraphCommons, which focuses on mapping, analyzing, and sharing network data. This project has leveraged our entire network expertise - from modeling and databases to visualization, as well as web development. We have integrated Neo4j for data management, and sigma.js and graphology for client-side operations. The website is built on Next.js and React. We continue to regularly develop new features while maintaining the application.
A Consulting and support project
Exploring a CMDB through ego-centered networks
One of the largest French industrial group indexed their whole CMDB in a Neo4j database. They contacted us to develop an interface to explore this dataset.
The web application is composed of a search engine and a unique page for each node, displaying its neighborhood and metadata. To make the search engine efficient (errors tolerance, searching on multiple fields), we indexed the corpus in an ElasticSearch base.
The frontend is developed with Angular, and the API runs on Node - the whole with TypeScript.
A Custom development project
The first version includes the search engine as well as the "professions of faith" pages.
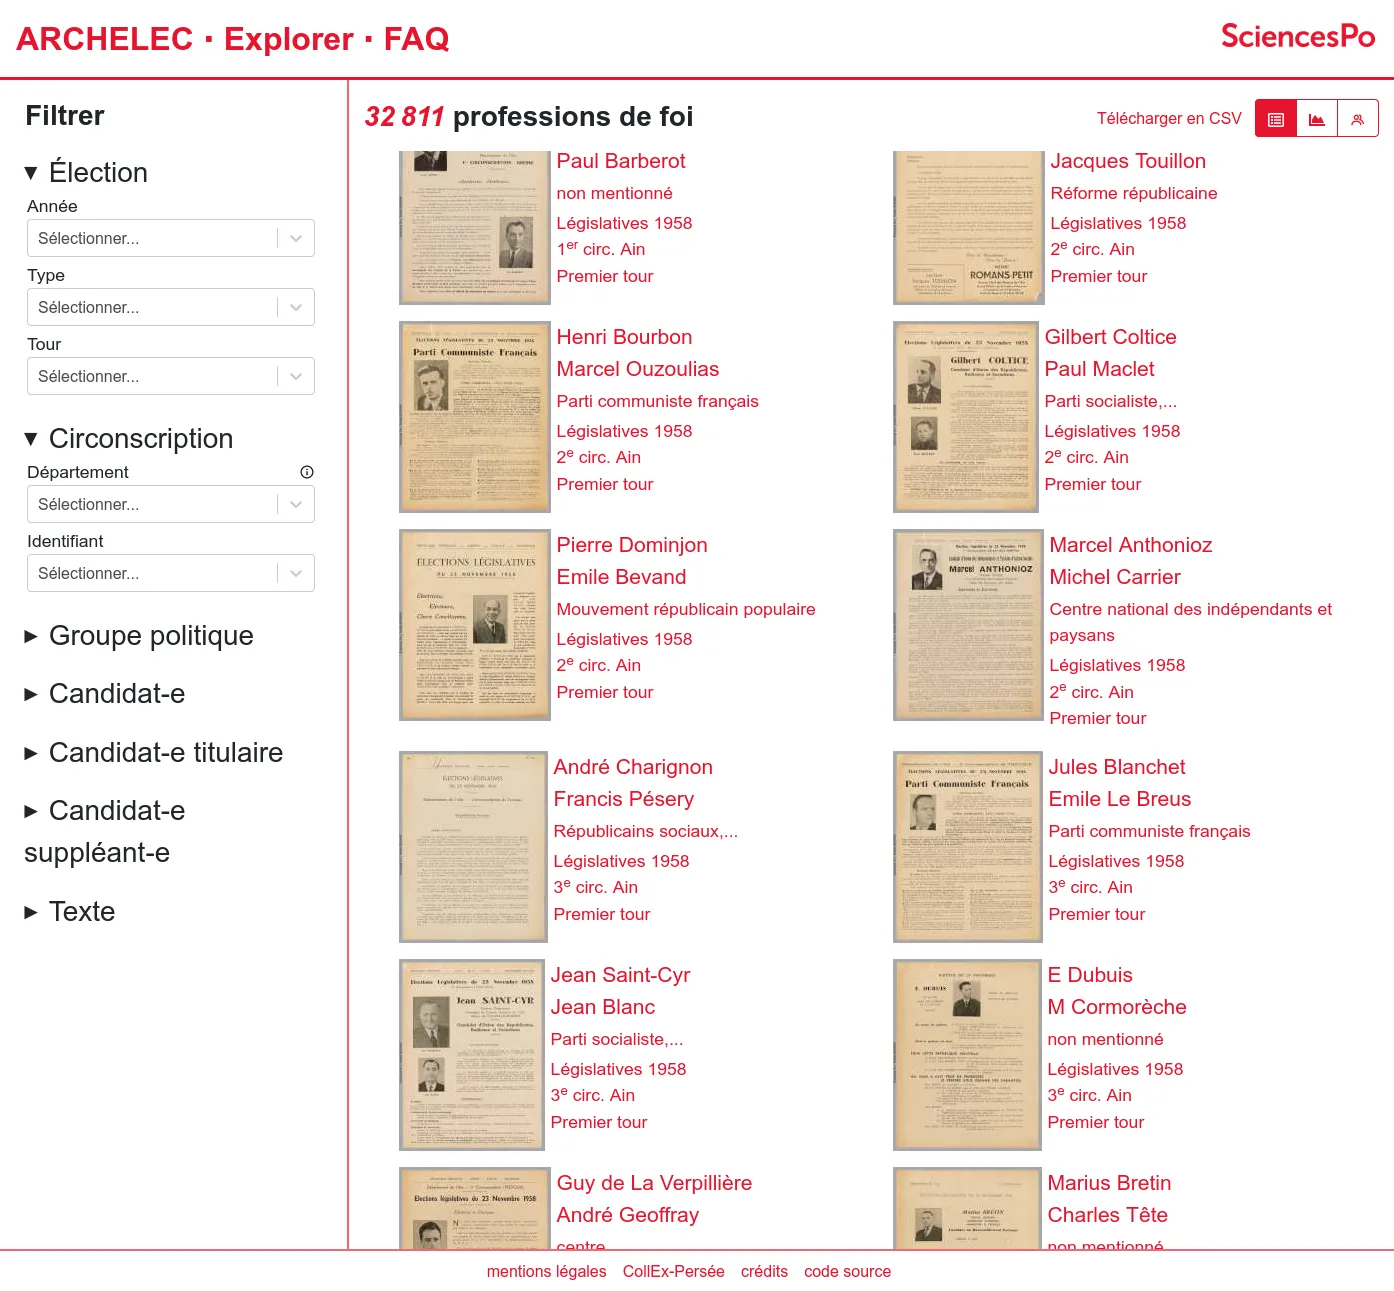
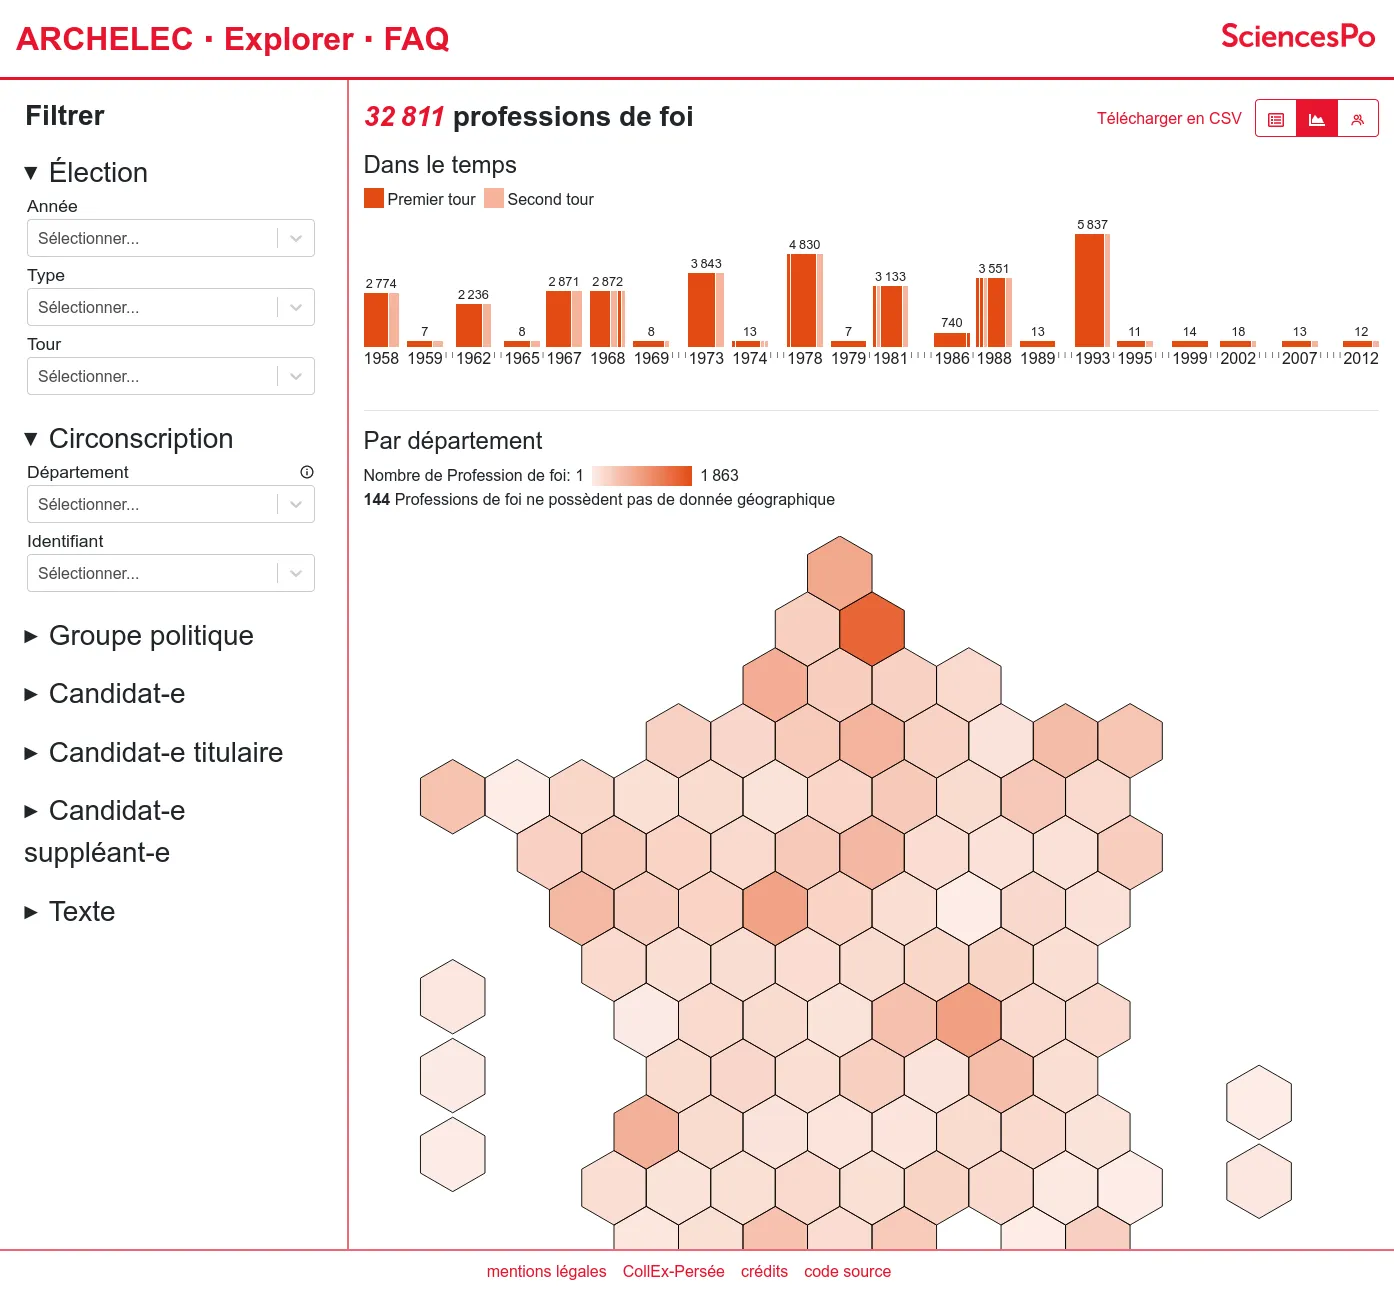
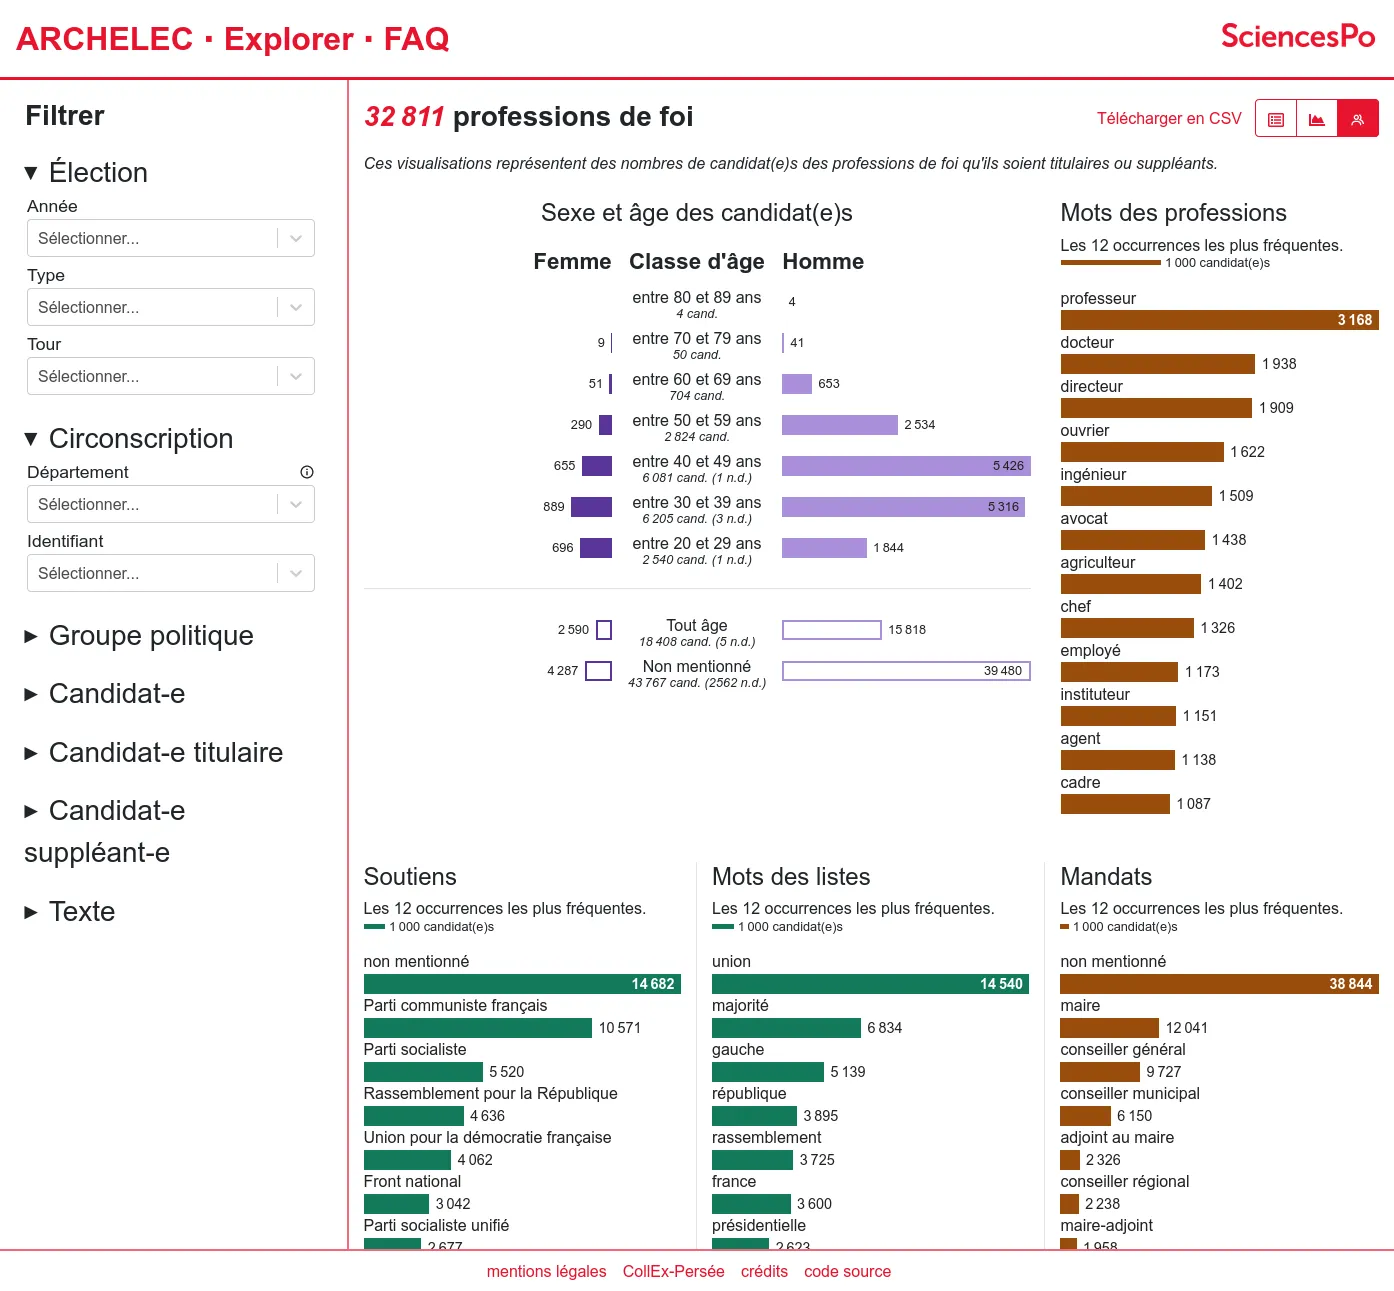
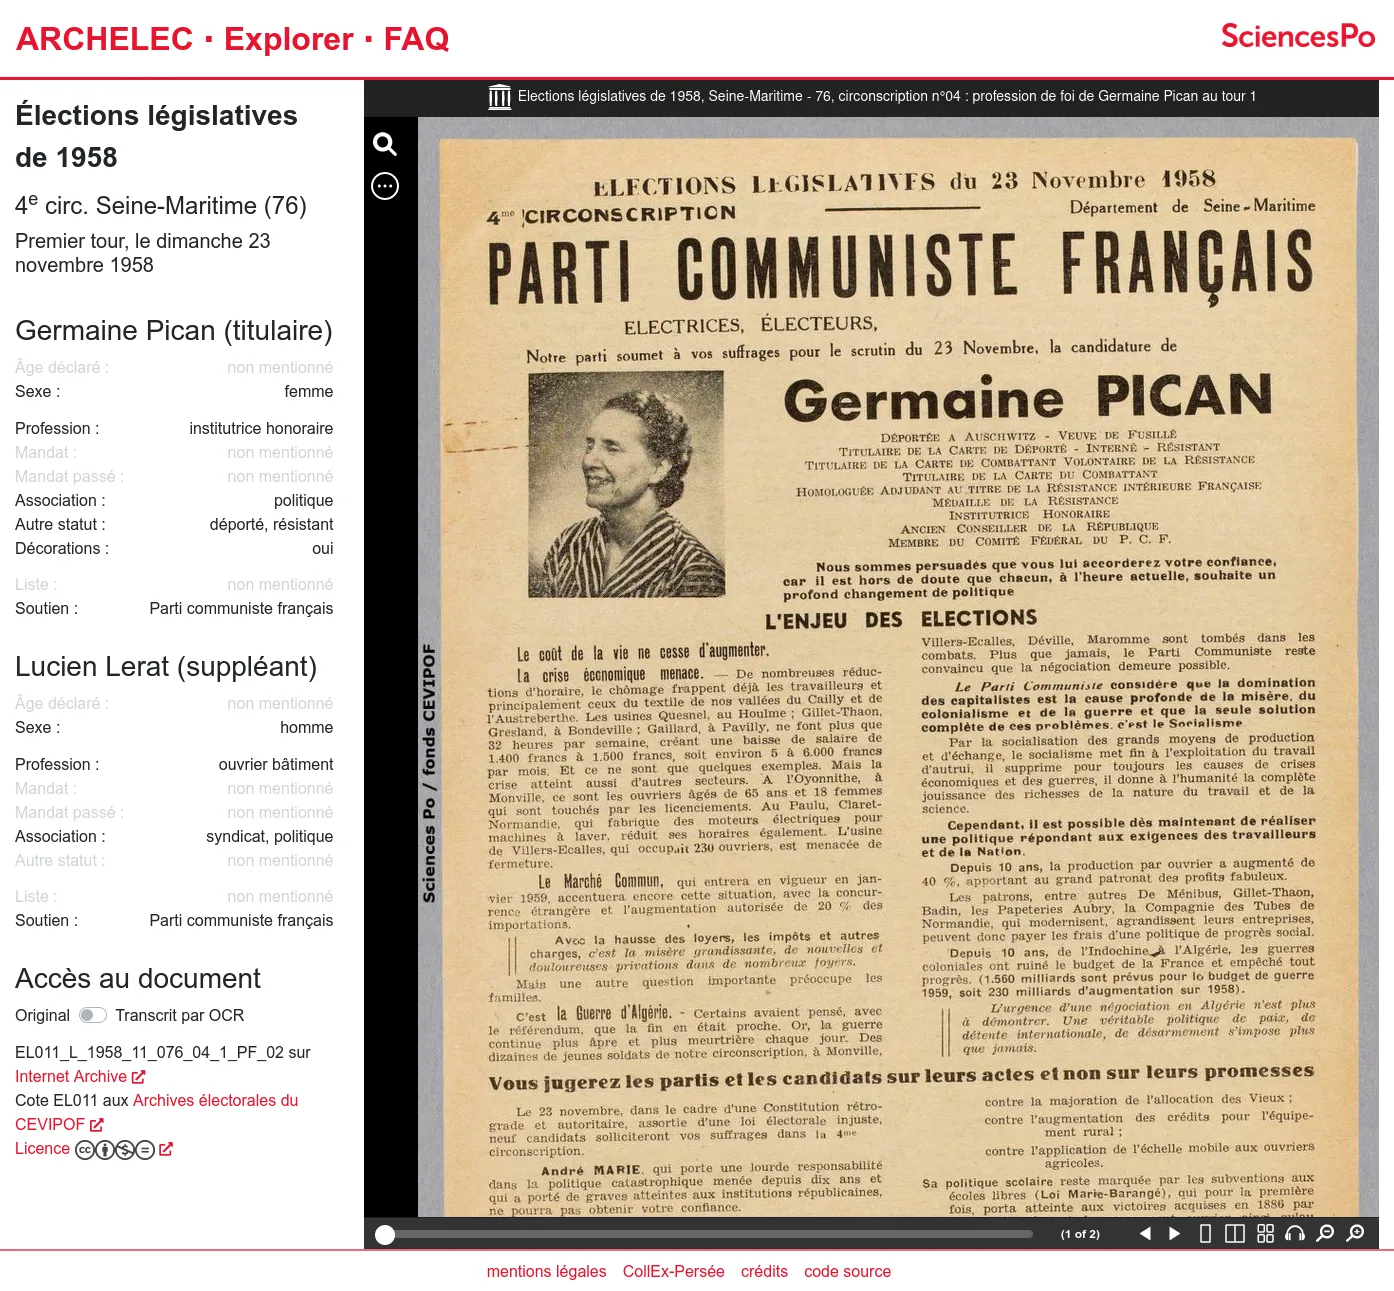
From 2013, the Sciences Po Library manage the publication of the electoral archives created by the Centre de recherches politiques (CEVIPOF) and now preserved by the Library Département archives: a unique collection of election (legislative but also presidential, european, etc.) candidates professions of faith from 1958.
After having published it on Internet Archive, the Sciences Po Library came to us to build a custom exploration tool. Indeed they built a very rich set of metadata which describe the candidates profils in details for the entire collection (more than thurty thousands documents). We created a faceted search engine alowing to filter the collection by election, electoral division, political group, candidates profils...
The resulting documents can then be explored either through lists, data visualisations or downloaded in CSV. The original documents are available thanks to Internet Archive's embeded player. Thus indexation choices made by the librarists and archivists can be checked against the source.
A Data valorization project
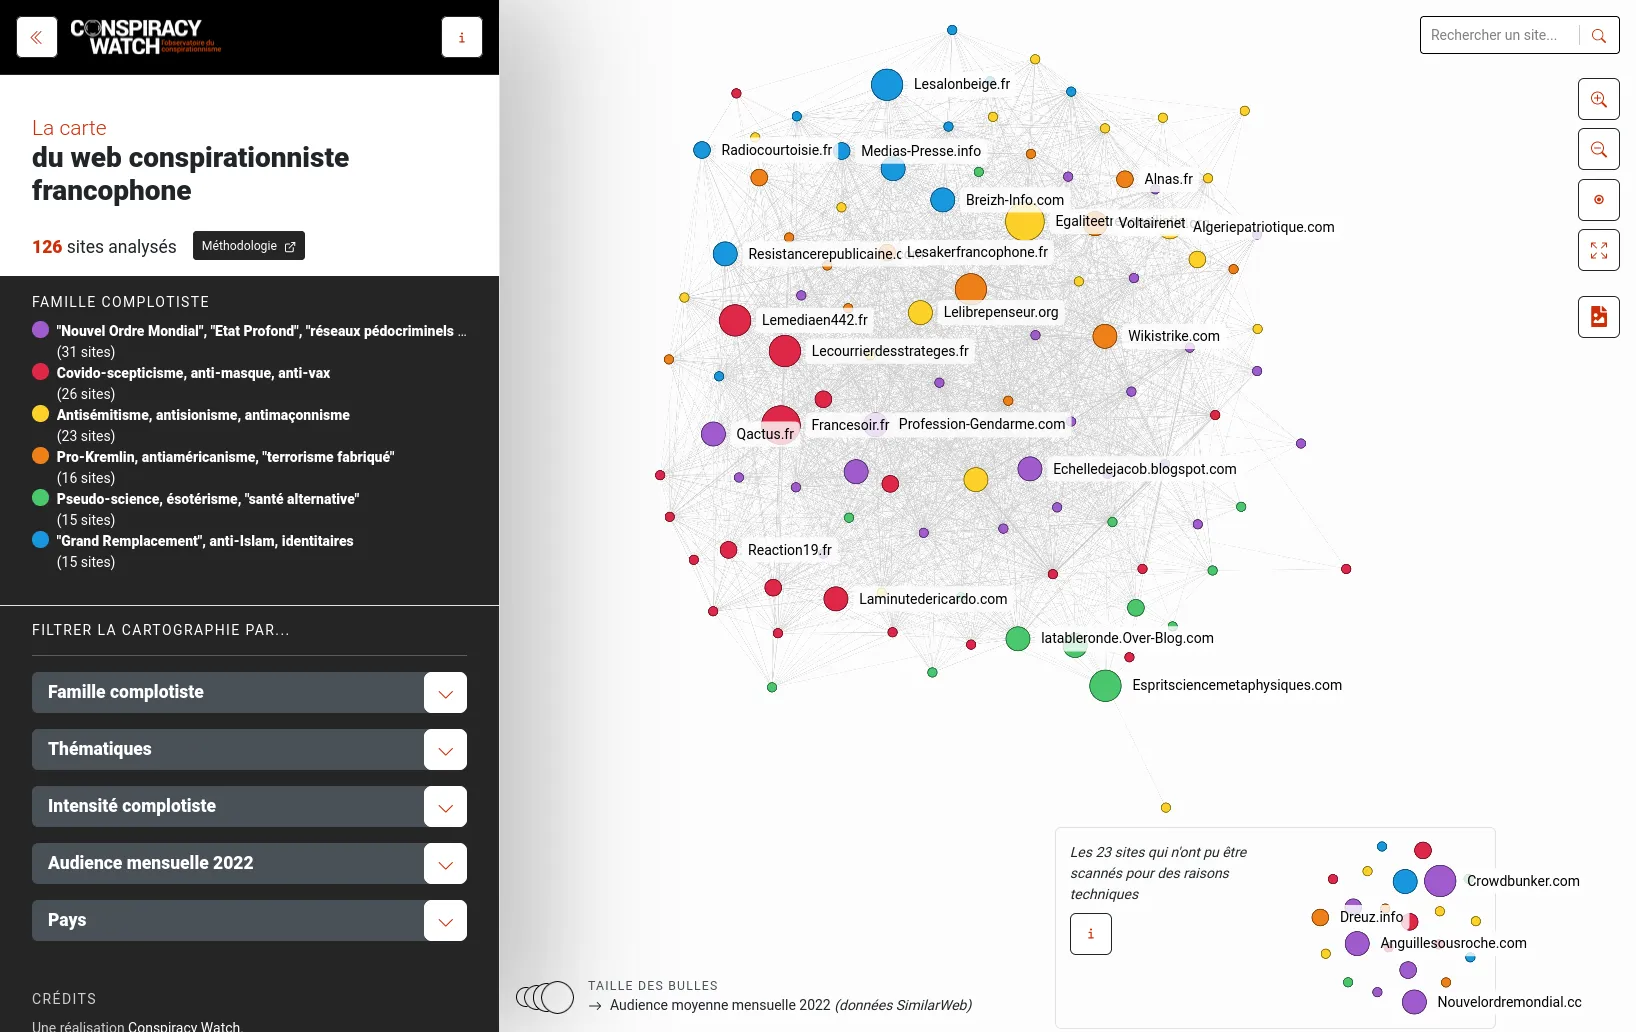
An open-source tool to share network visualizations online, sponsored by the Centre Internet et Société.
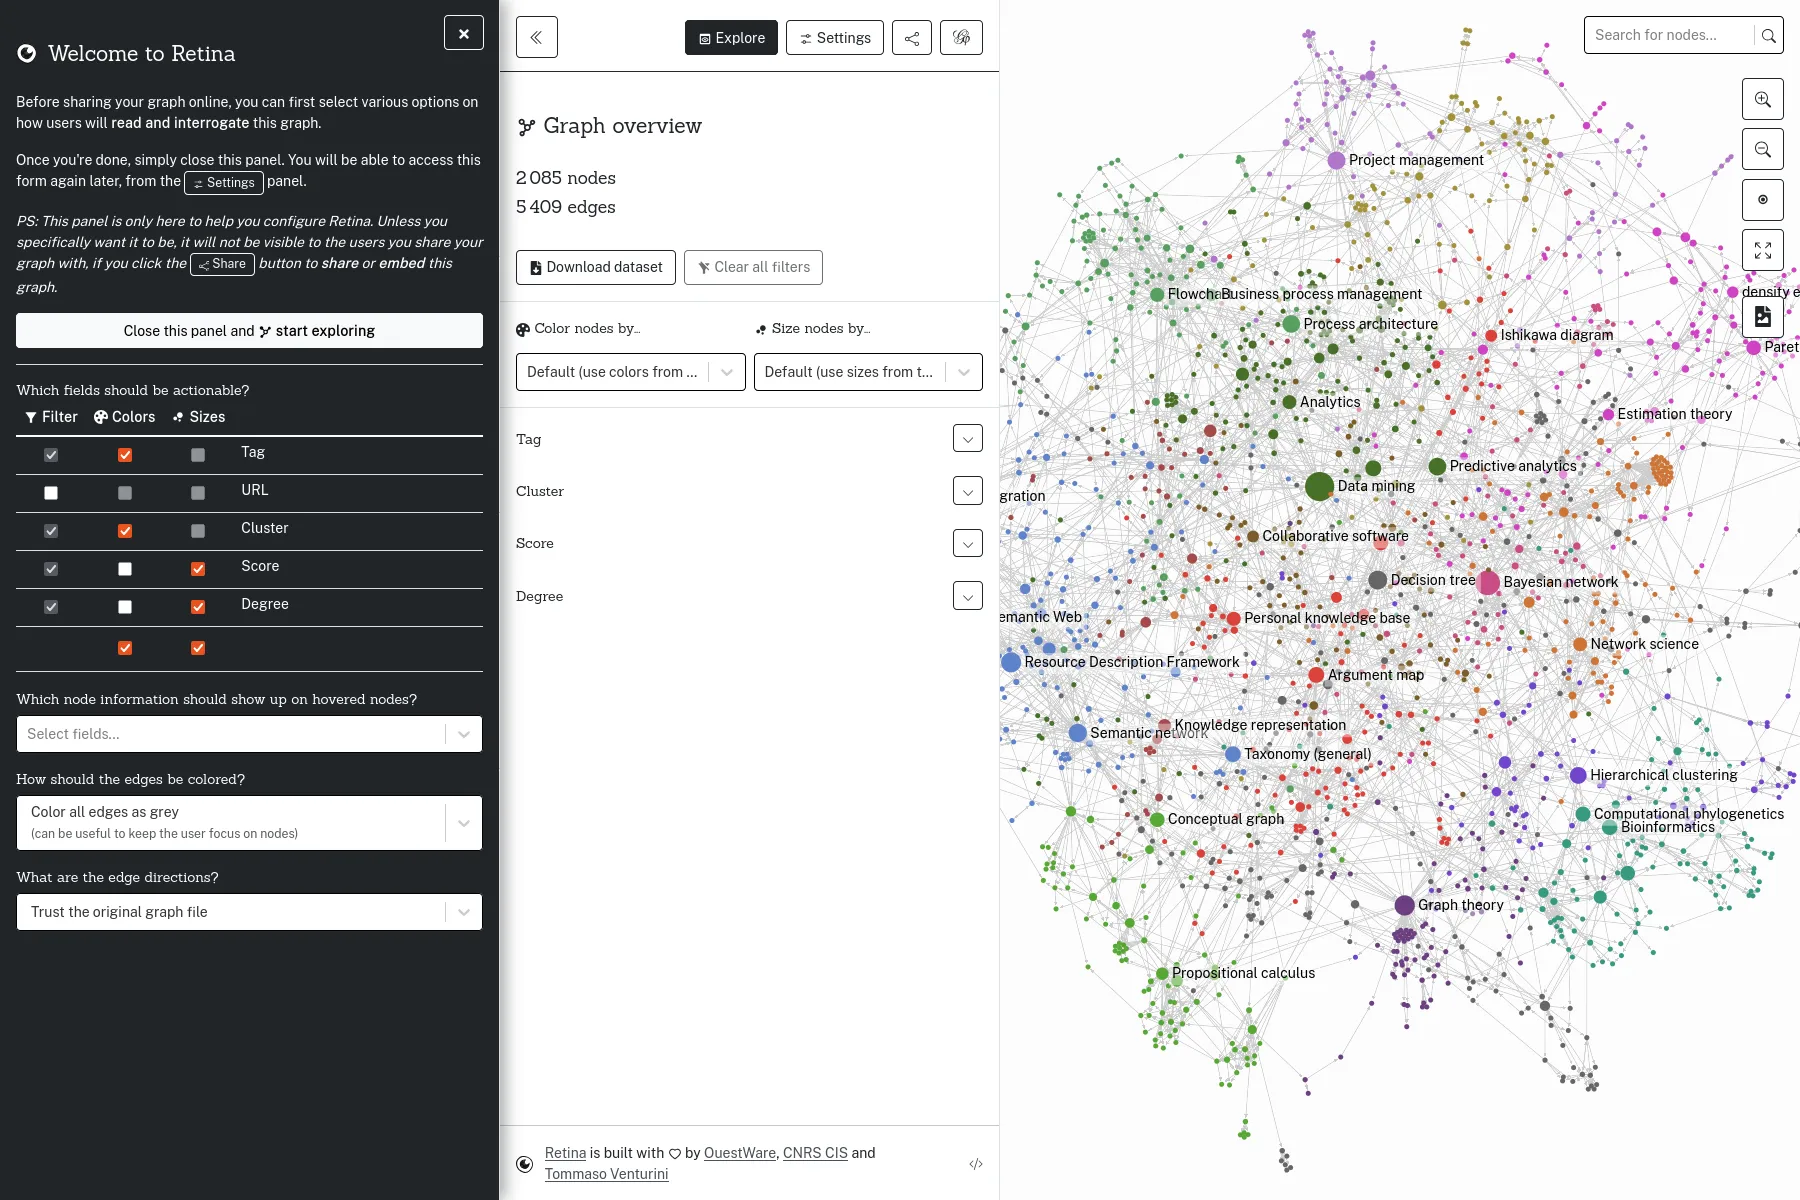
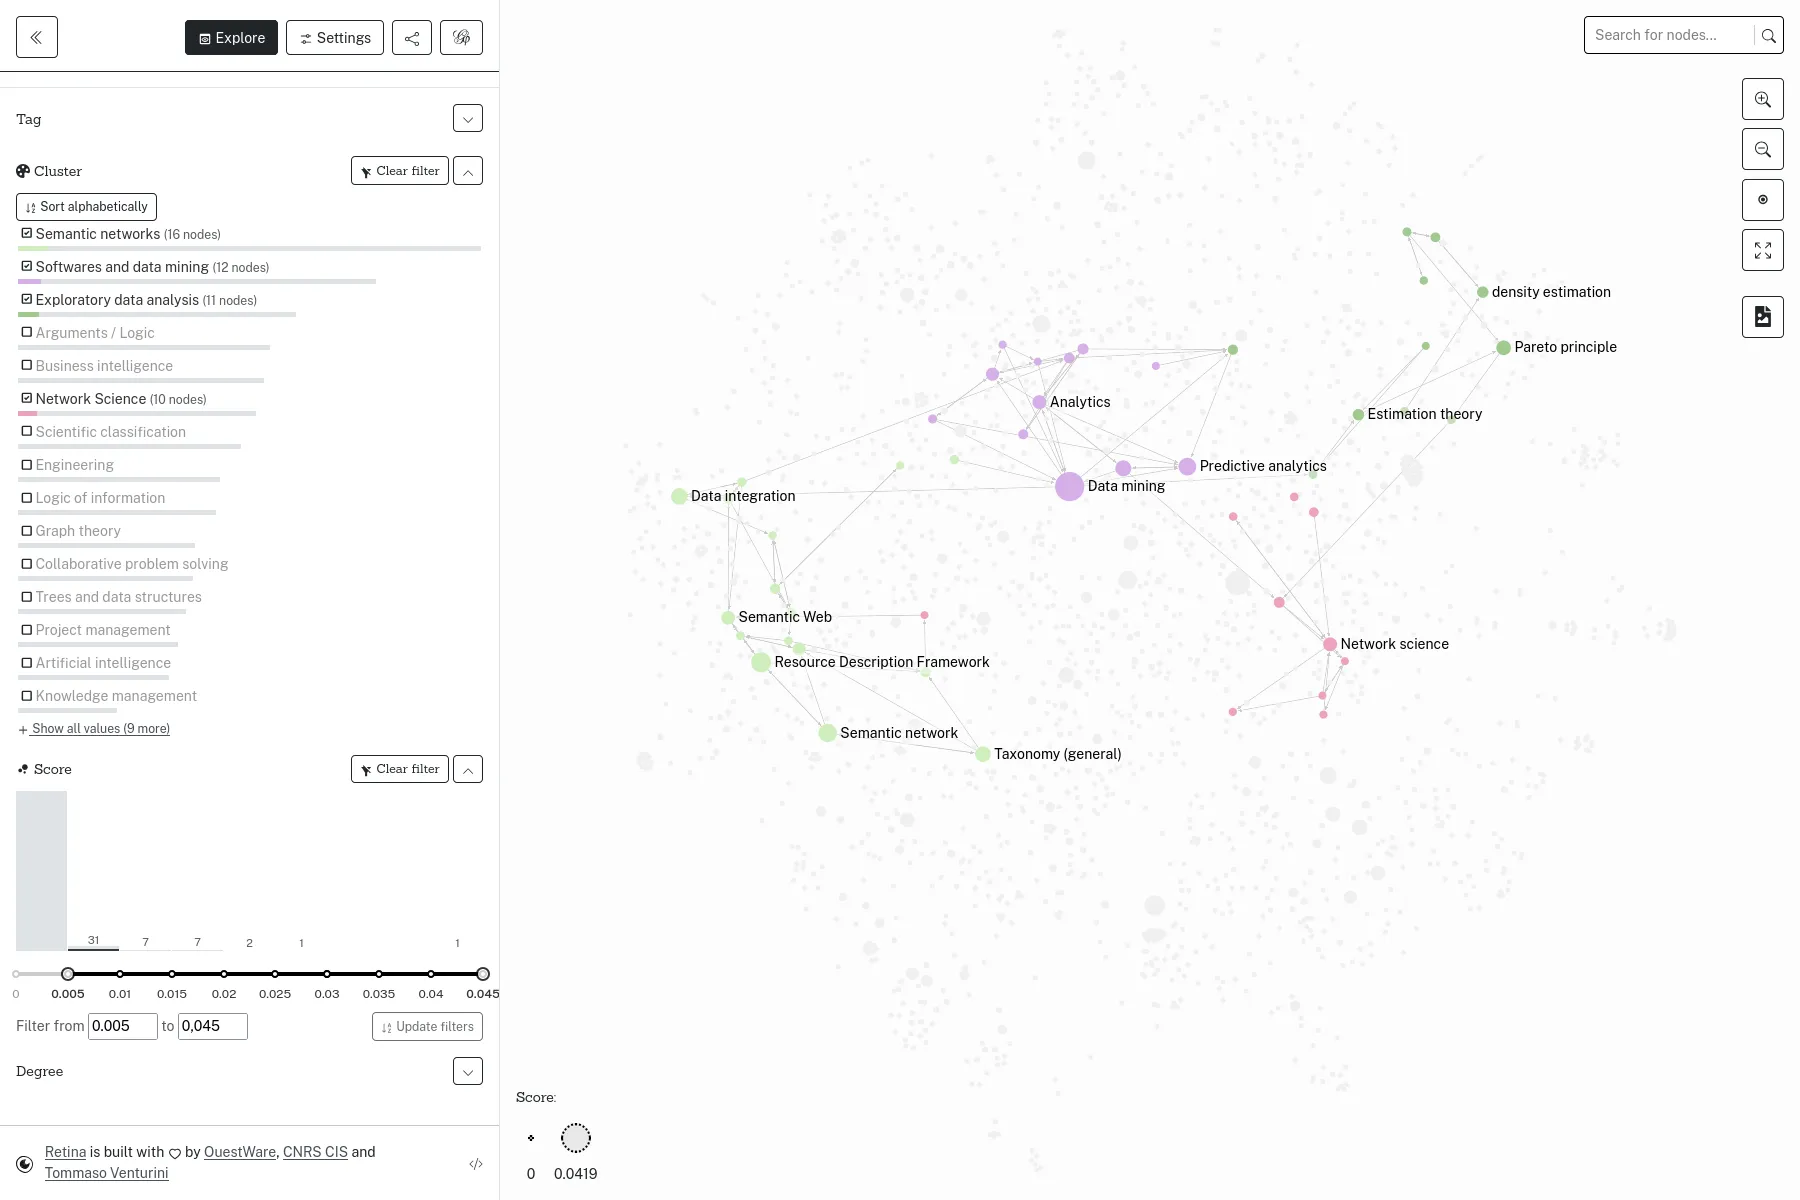
Retina is an open-source web application, to share network visualizations online, without having any server to administrate. Initiated by Tommaso Venturini and the Center for Internet and Society from CNRS in 2021, Retina is used by various actors, notably within the Gephi users community. We also used it as a base, to develop with WeDoData the conspiracy theorists network on the french Web, for Conspiracy Watch.
The user interface allows selecting which data fields to use for the nodes sizes and colors. It also allows filtering nodes, or search for some specific node. Technically, everything happens in the web browser, and the full application state is described in the URL. Data files can be loaded from any web server allowing Cross-origin resource sharing, such as GitHub Gist for instance.
A Open Source and Open Data project
This version, as part of our maintenance contract, adds the management of collections and updates the code dependencies.
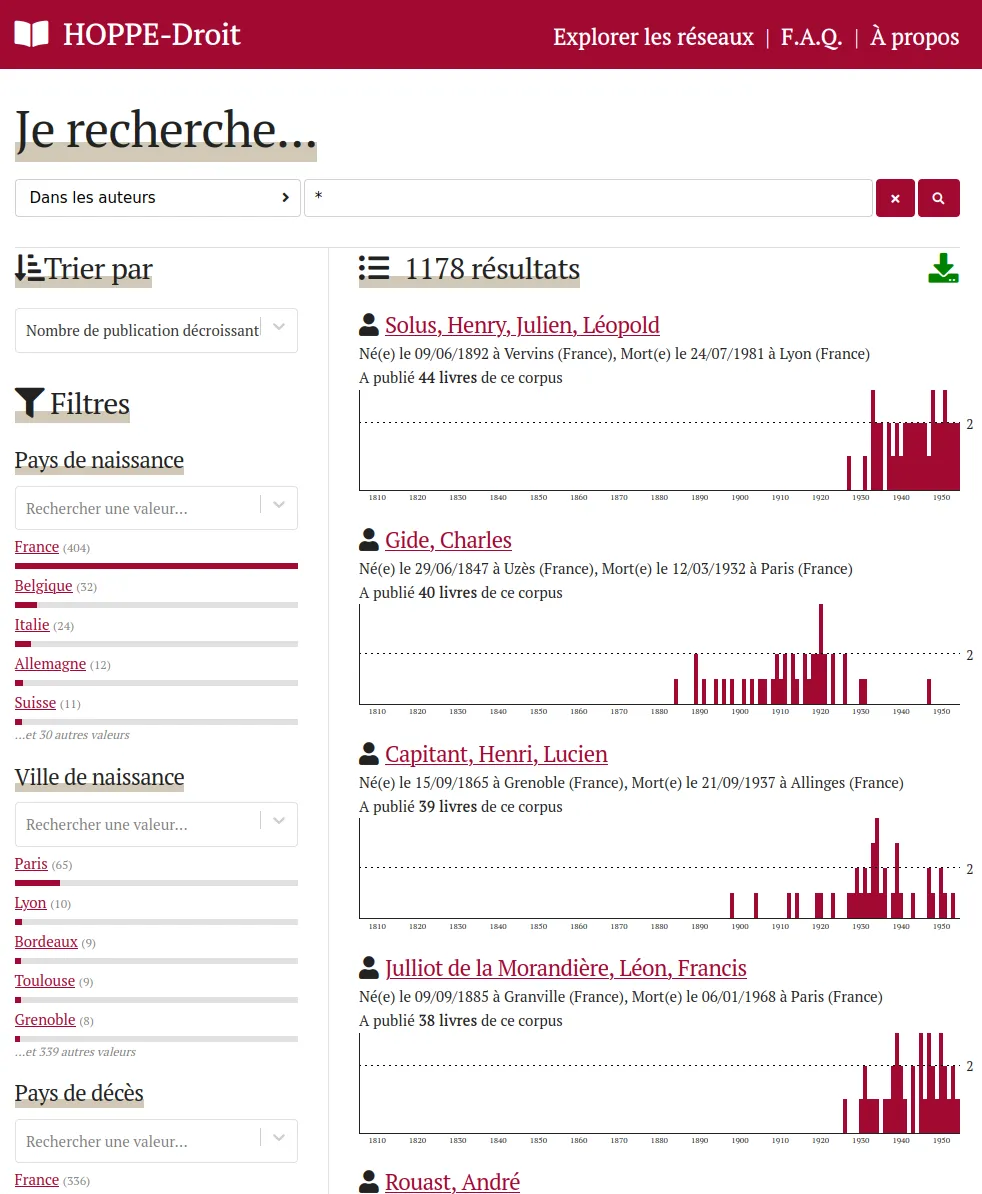
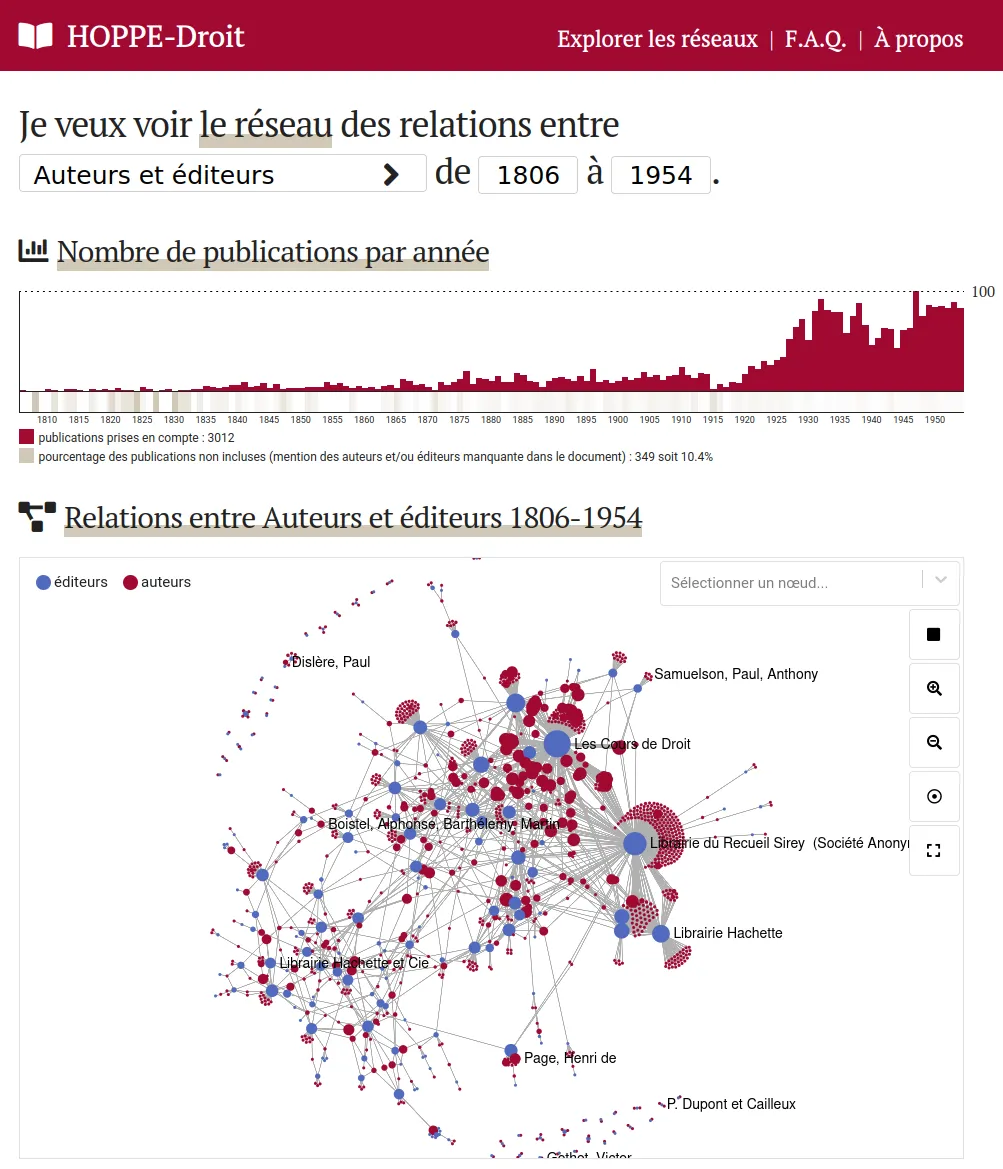
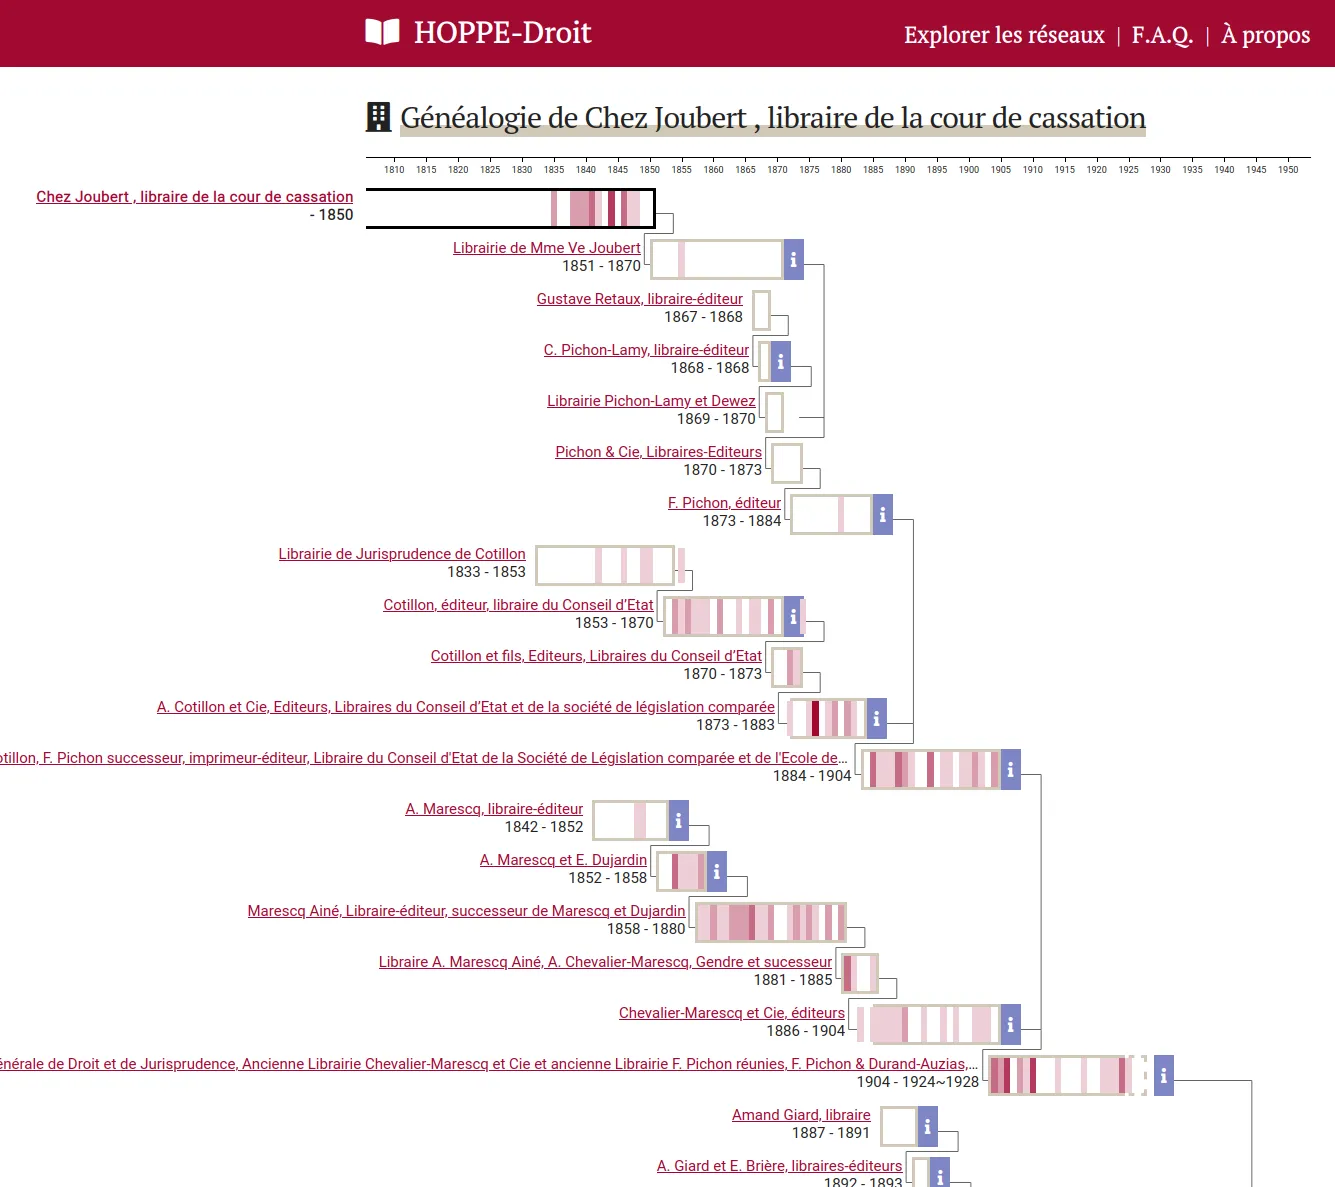

Explore a 19th-20th centuries French law educational works collection
The HOPPE-Droit projects aims to create and publish a collection of French law educational works from the 19th-20th centuries. We designed and developed an exploration tool which help studying the evolutions of the French law through education materials from the 19th century.
The dataset is edited by the CUJAS team in a Heurist database. These data are exported through API to be indexed into ElasticSearch. We made sure to keep data complexity by for instance taking care of dates incertainty and levels of precision. A web application finally allows to explore the dataset under different angles: books, authors, editors, co-publication networks, genealogies...
A Custom development project
David F. Johnson, Paul Girard, and Benoit Simard
Digital Humanities 2022, Tokyo, Japan
![[object Object]](/_astro/schema_creation.CZxo5Nmu_ZPV9IT.webp)

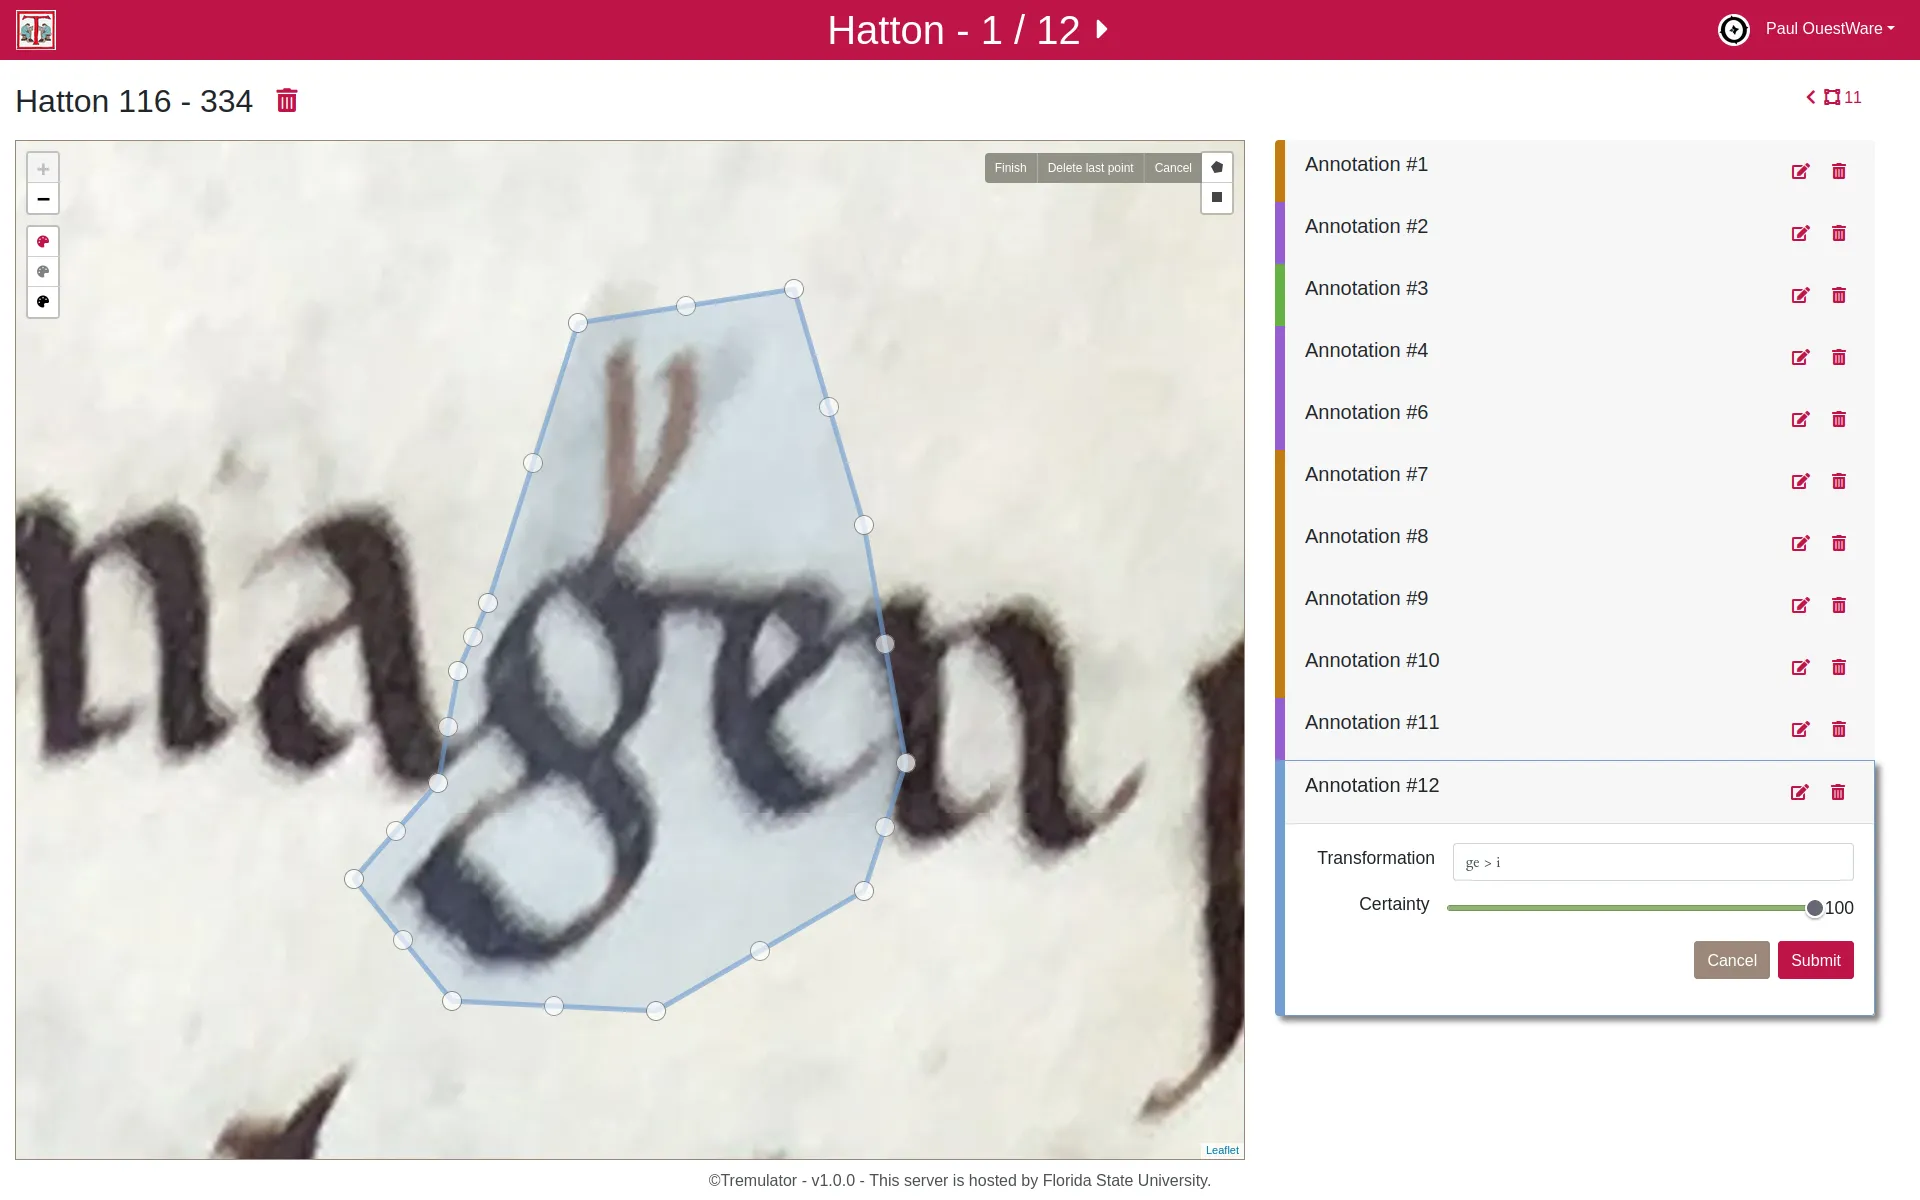
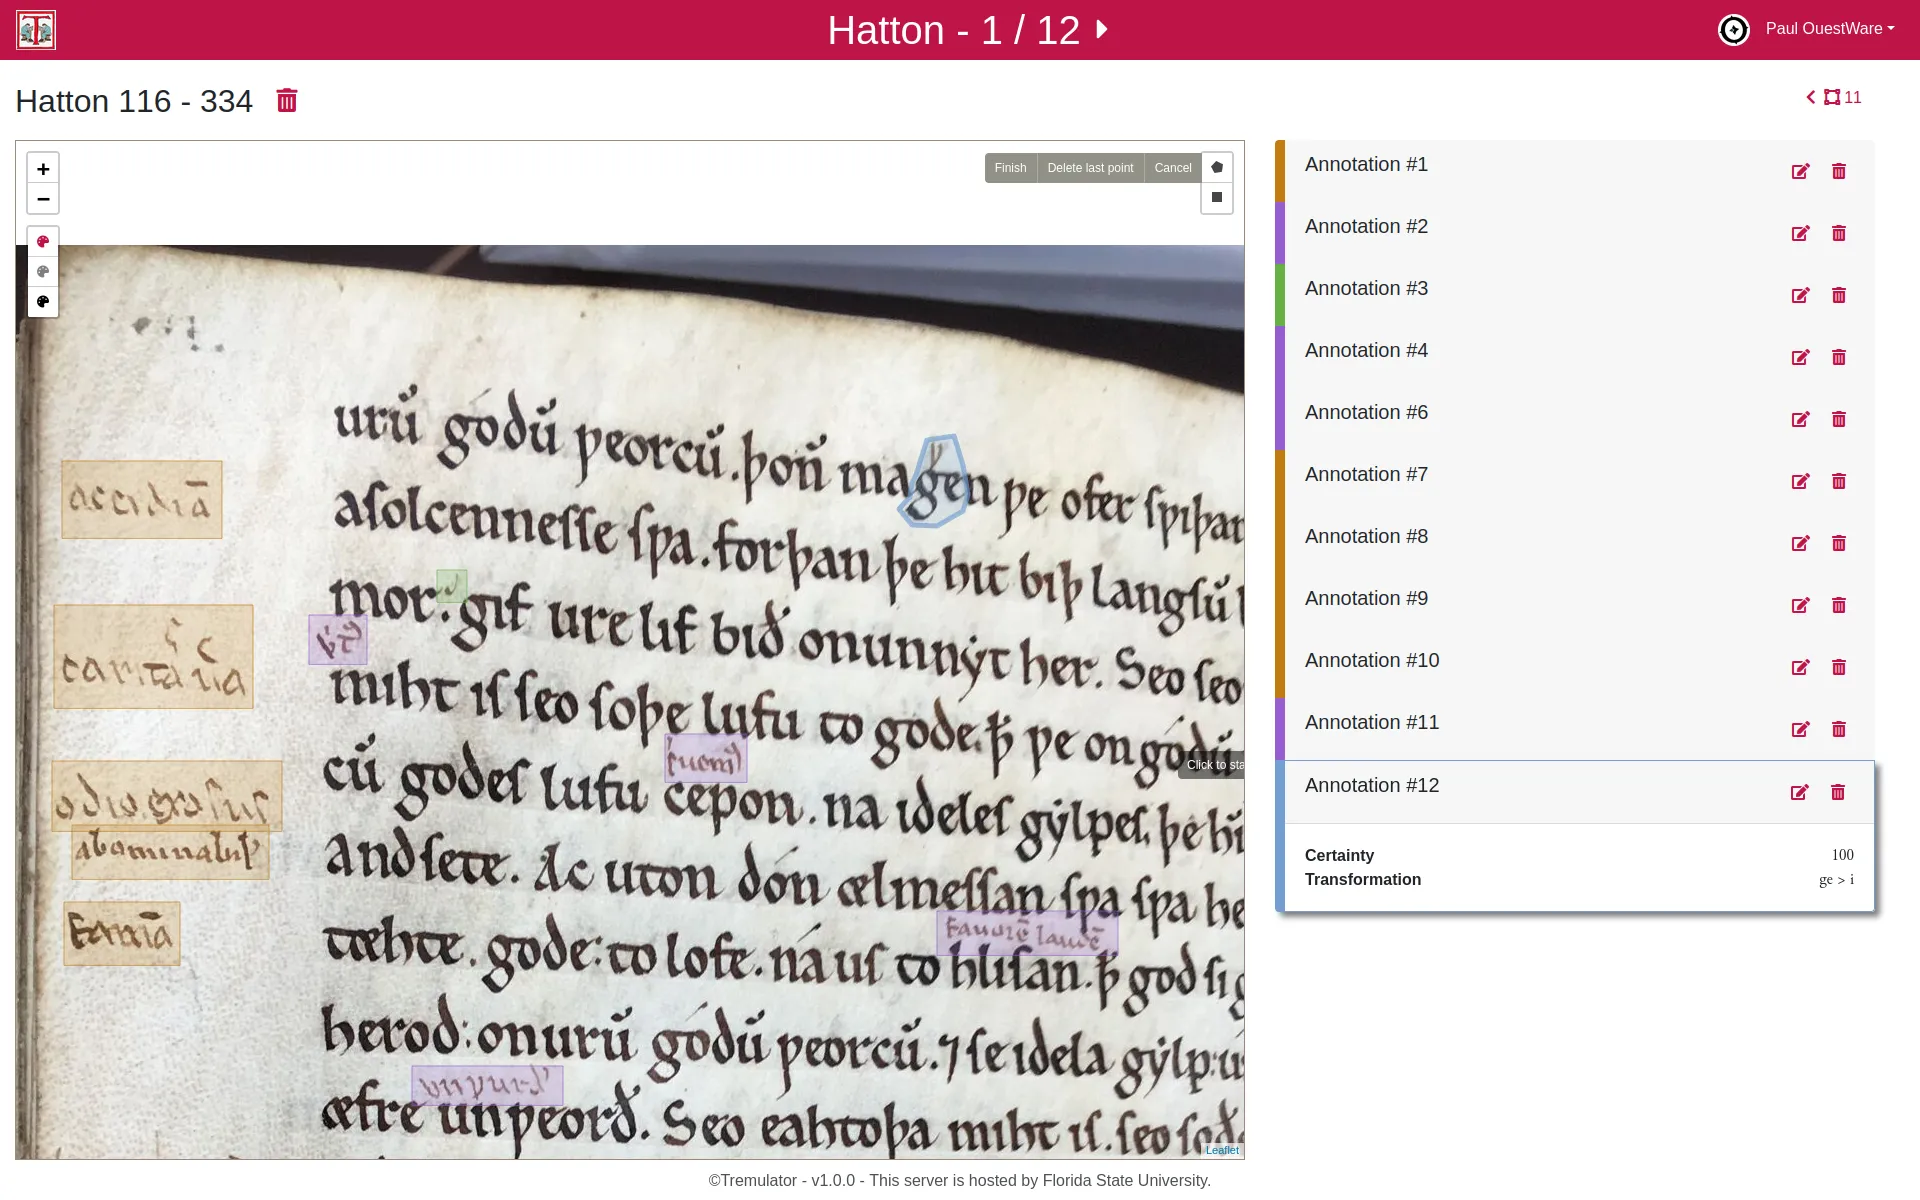
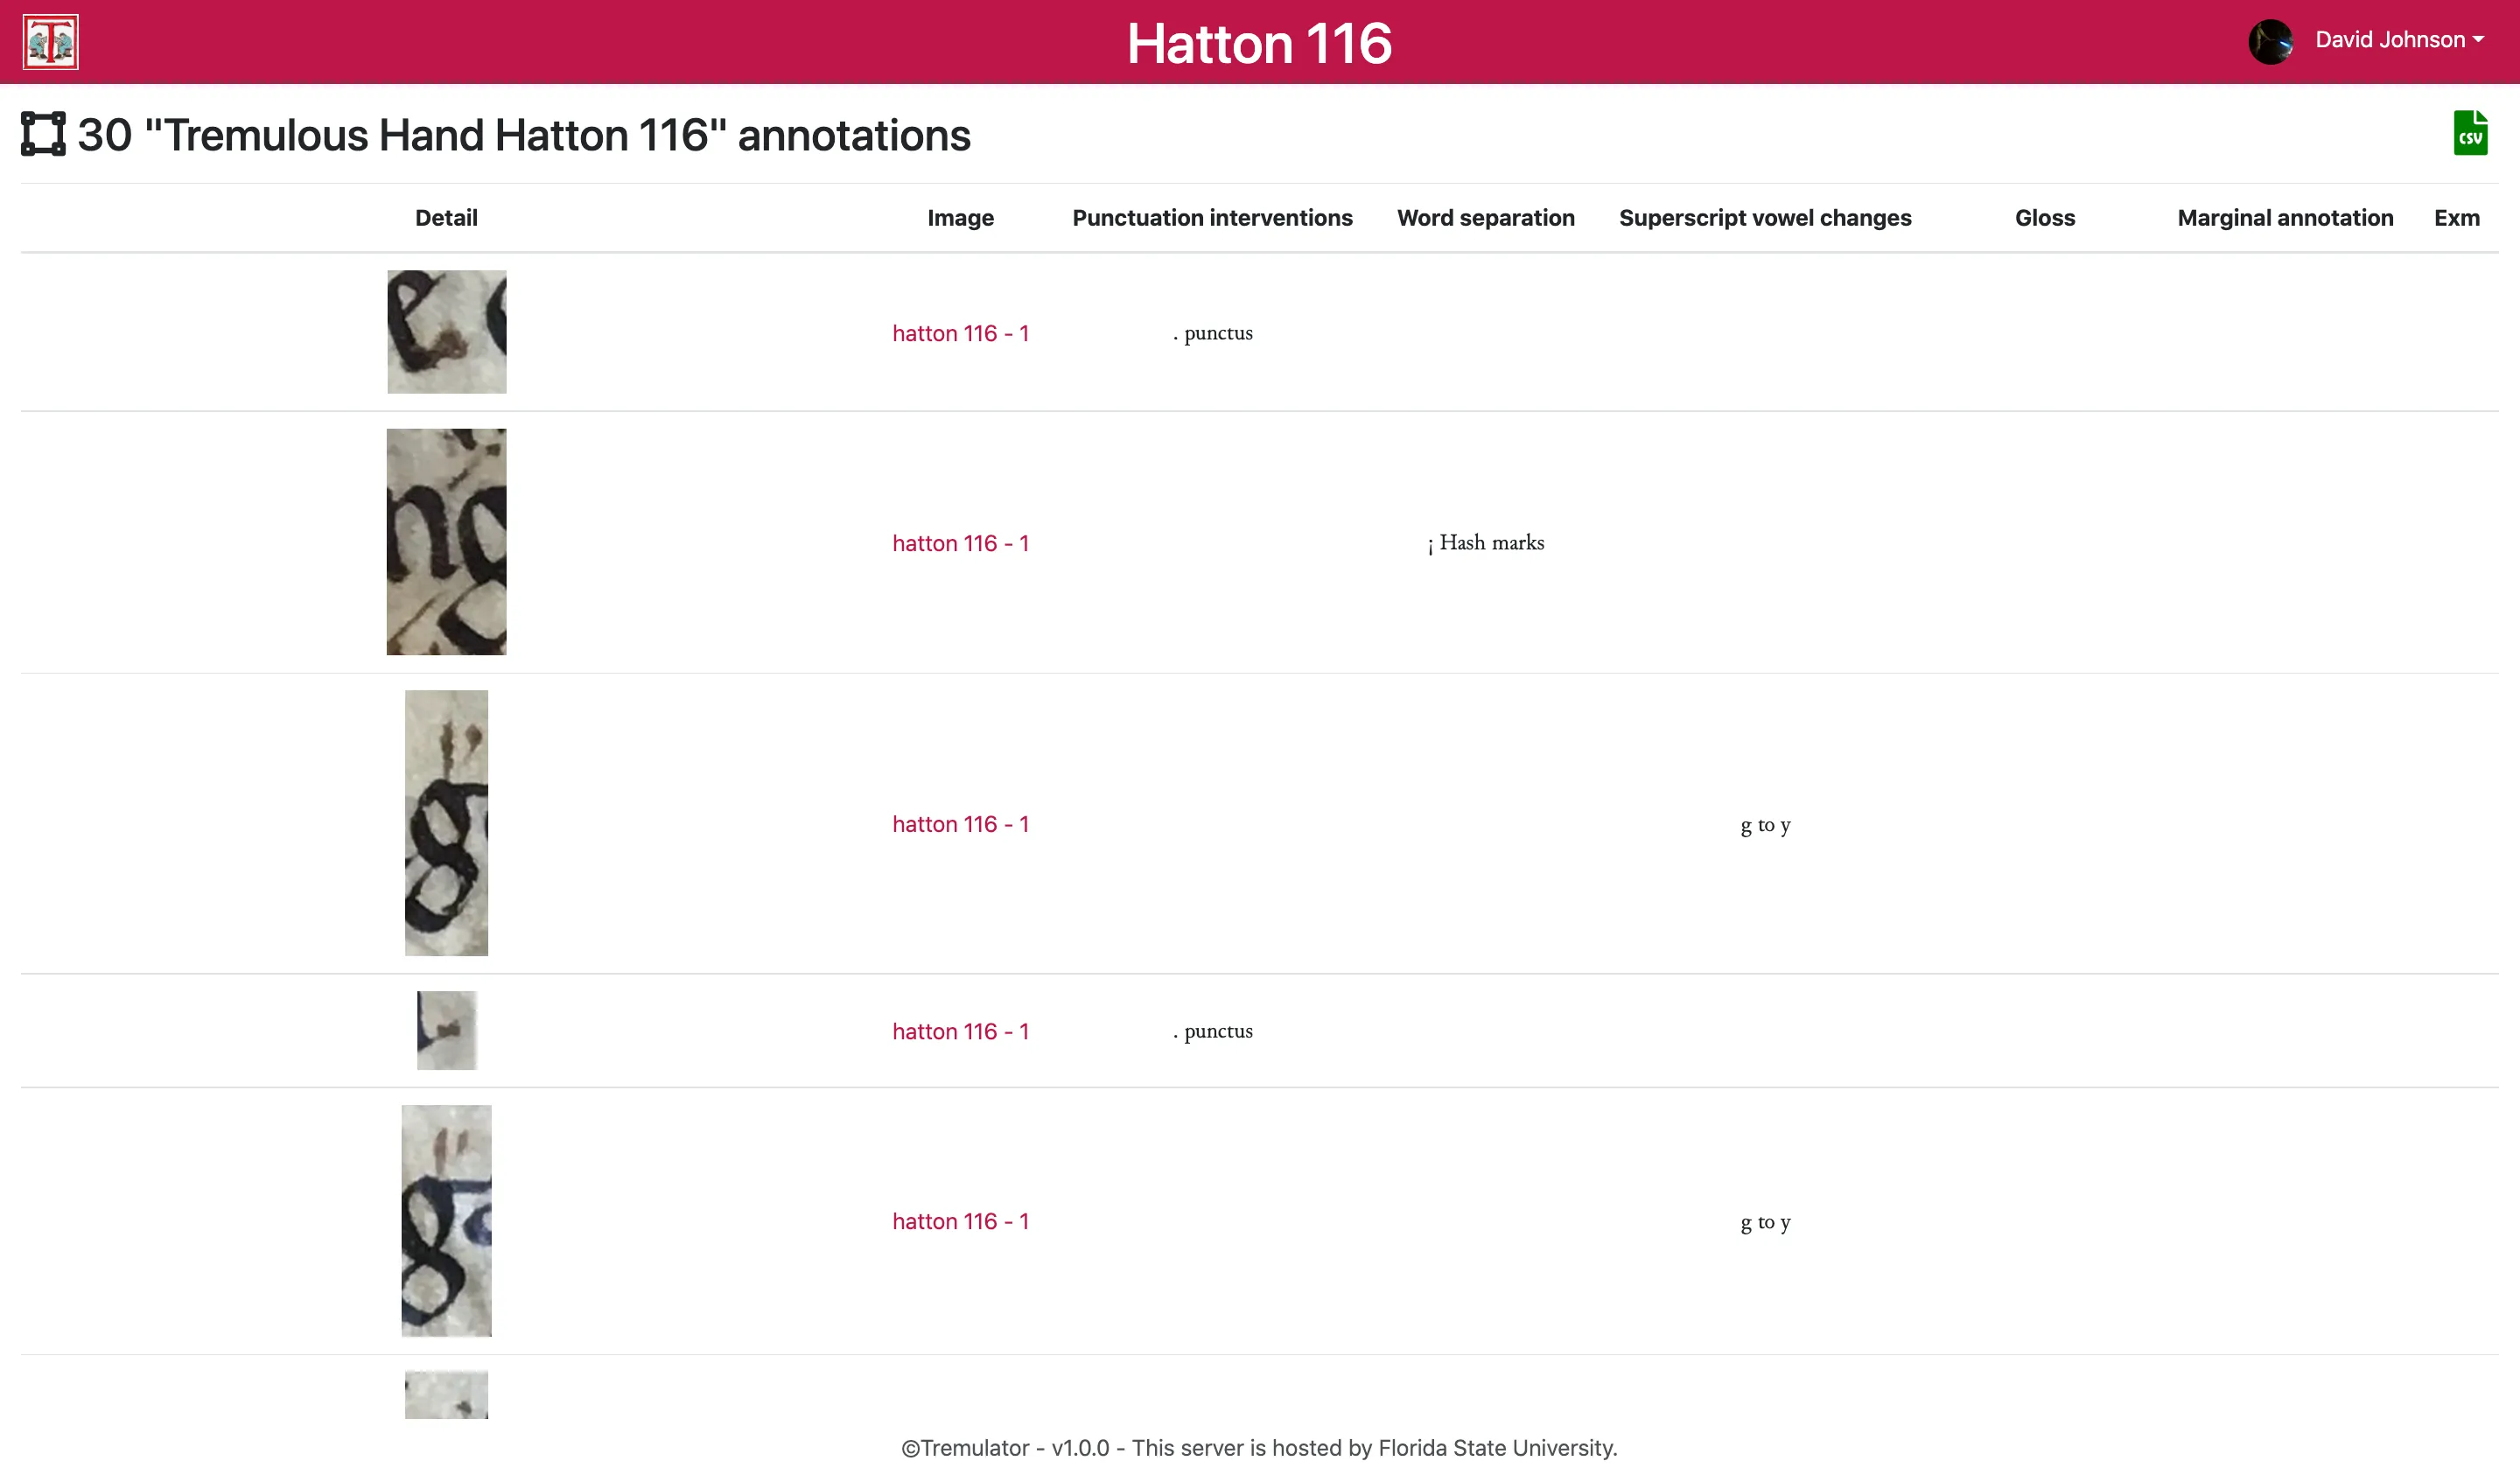
Medieval manuscripts rarely bear direct evidence of ownership, but researchers can trace signs of use —such as annotations, punctuation, and marginalia— to understand how these books were read and studied. One notable example is the “Tremulous Hand of Worcester,” a 13th-century monk who annotated Old English texts, using unique punctuation to decipher and interpret the older language. His interventions reveal both his learning process and the specific parts of the texts that interested him, offering a window into medieval reading practices.
To analyze these signs systematically, Prof. David Johnson uses digital annotations to capture and index reading interventions from manuscript images. Unlike traditional transcription, this method focuses only on the traces left by readers, creating a dataset for quantitative analysis. By linking close reading of individual annotations with broader “distant reading” techniques, researchers can uncover patterns and insights across entire collections, bridging detailed study with large-scale data analysis.
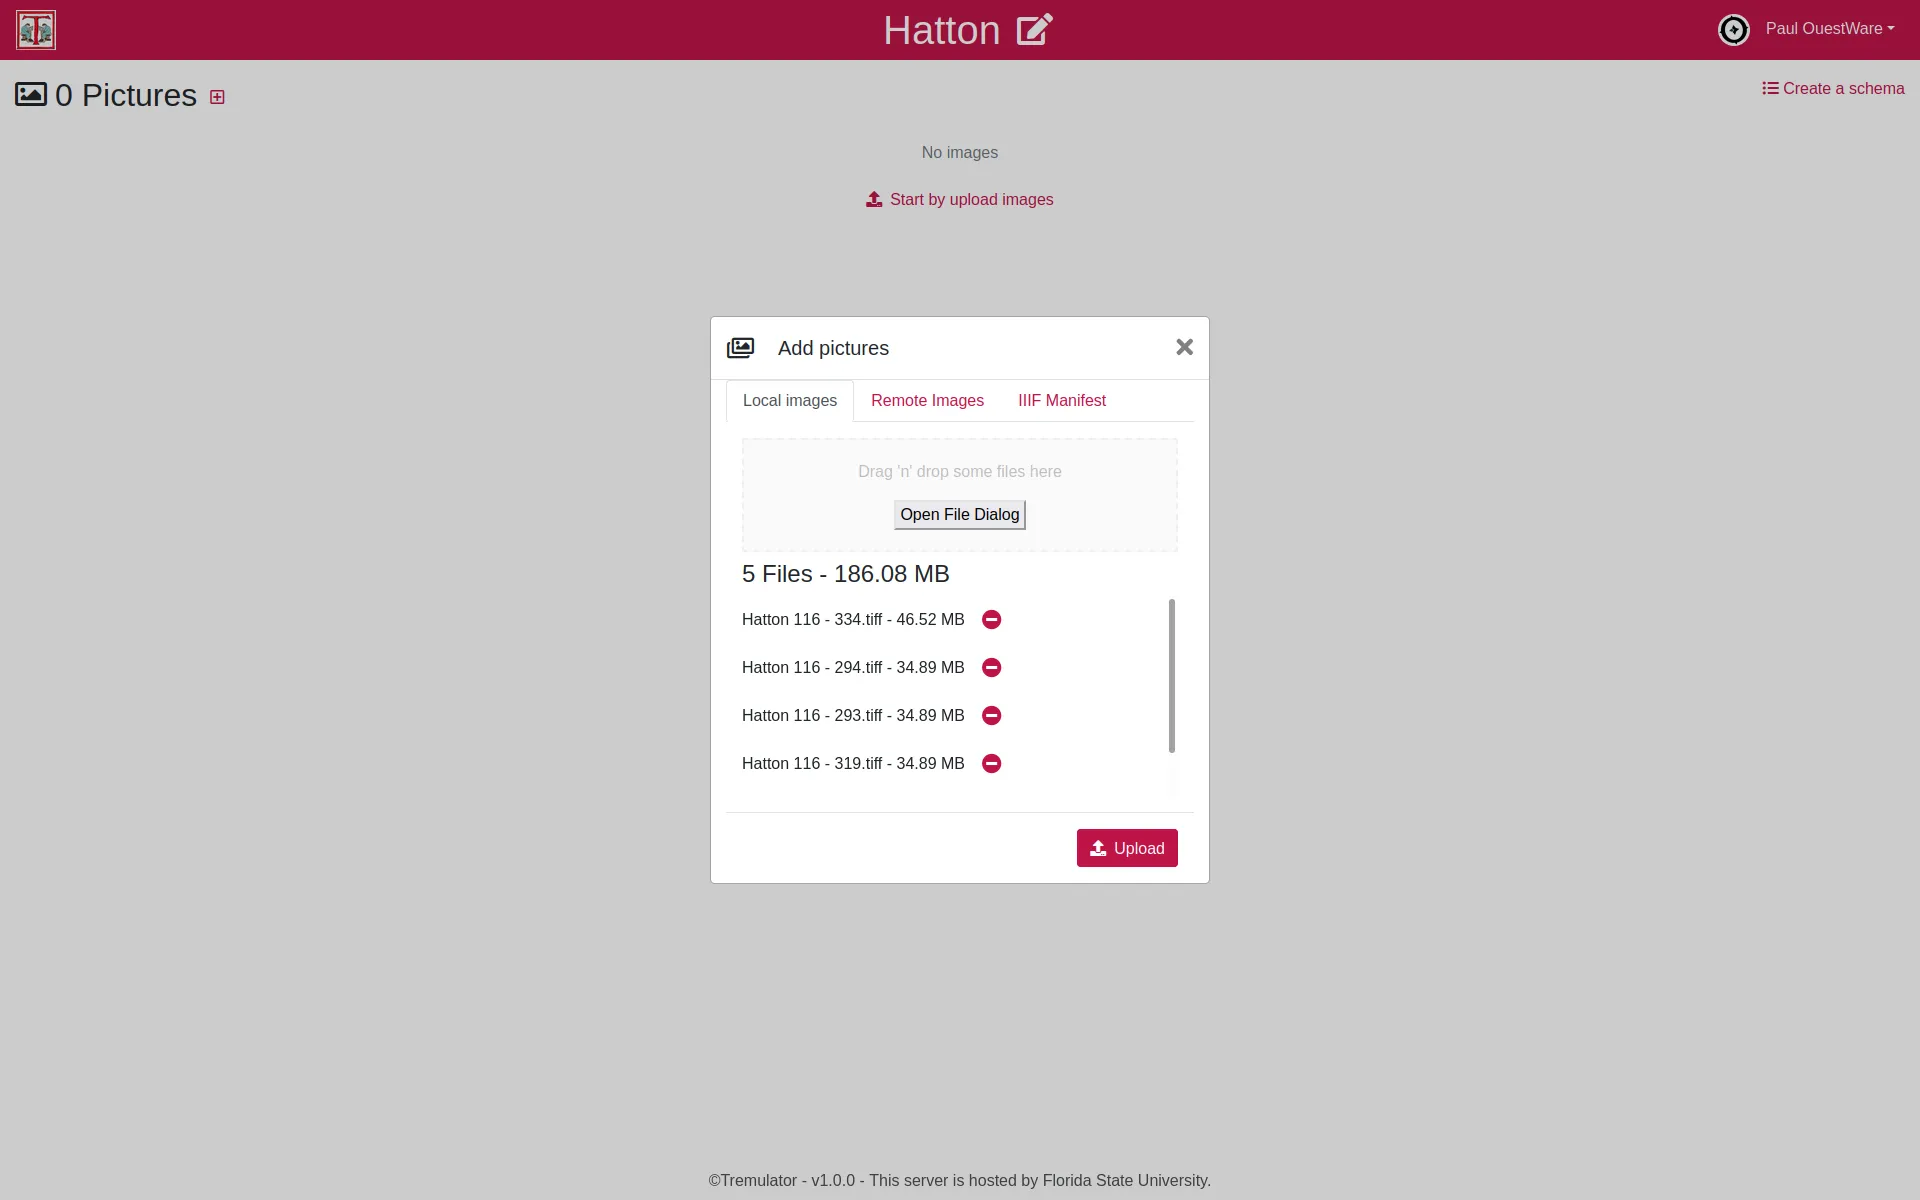
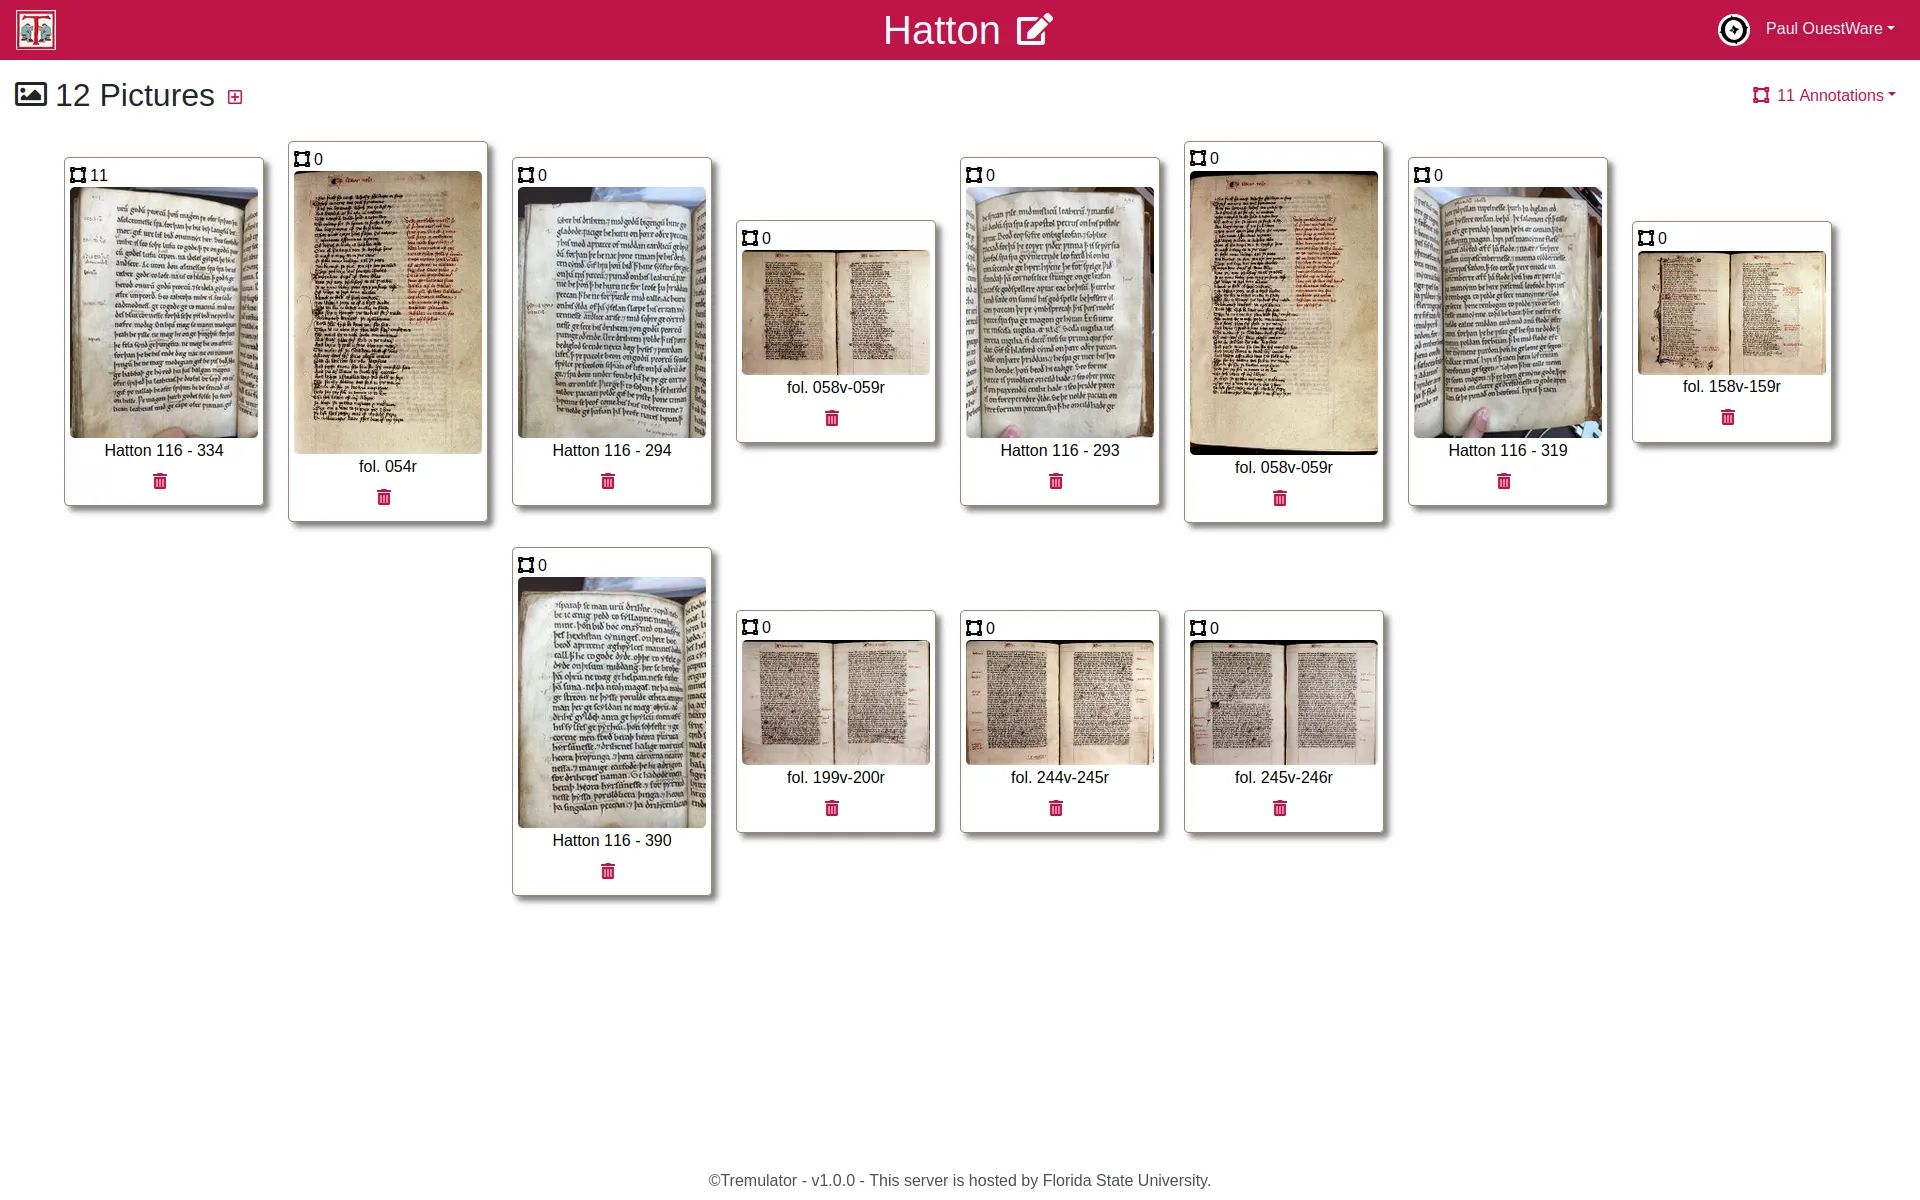
The Tremulator 2.0 application was developed to support this approach, using IIIF standards to access high-resolution images and allowing custom annotation schemas for diverse research needs. It enables users to collect, explore, and export data. This tool is valuable not only for manuscript studies but also for digital humanities, art history, and other fields requiring the analysis of irregular visual data.
A Custom development project
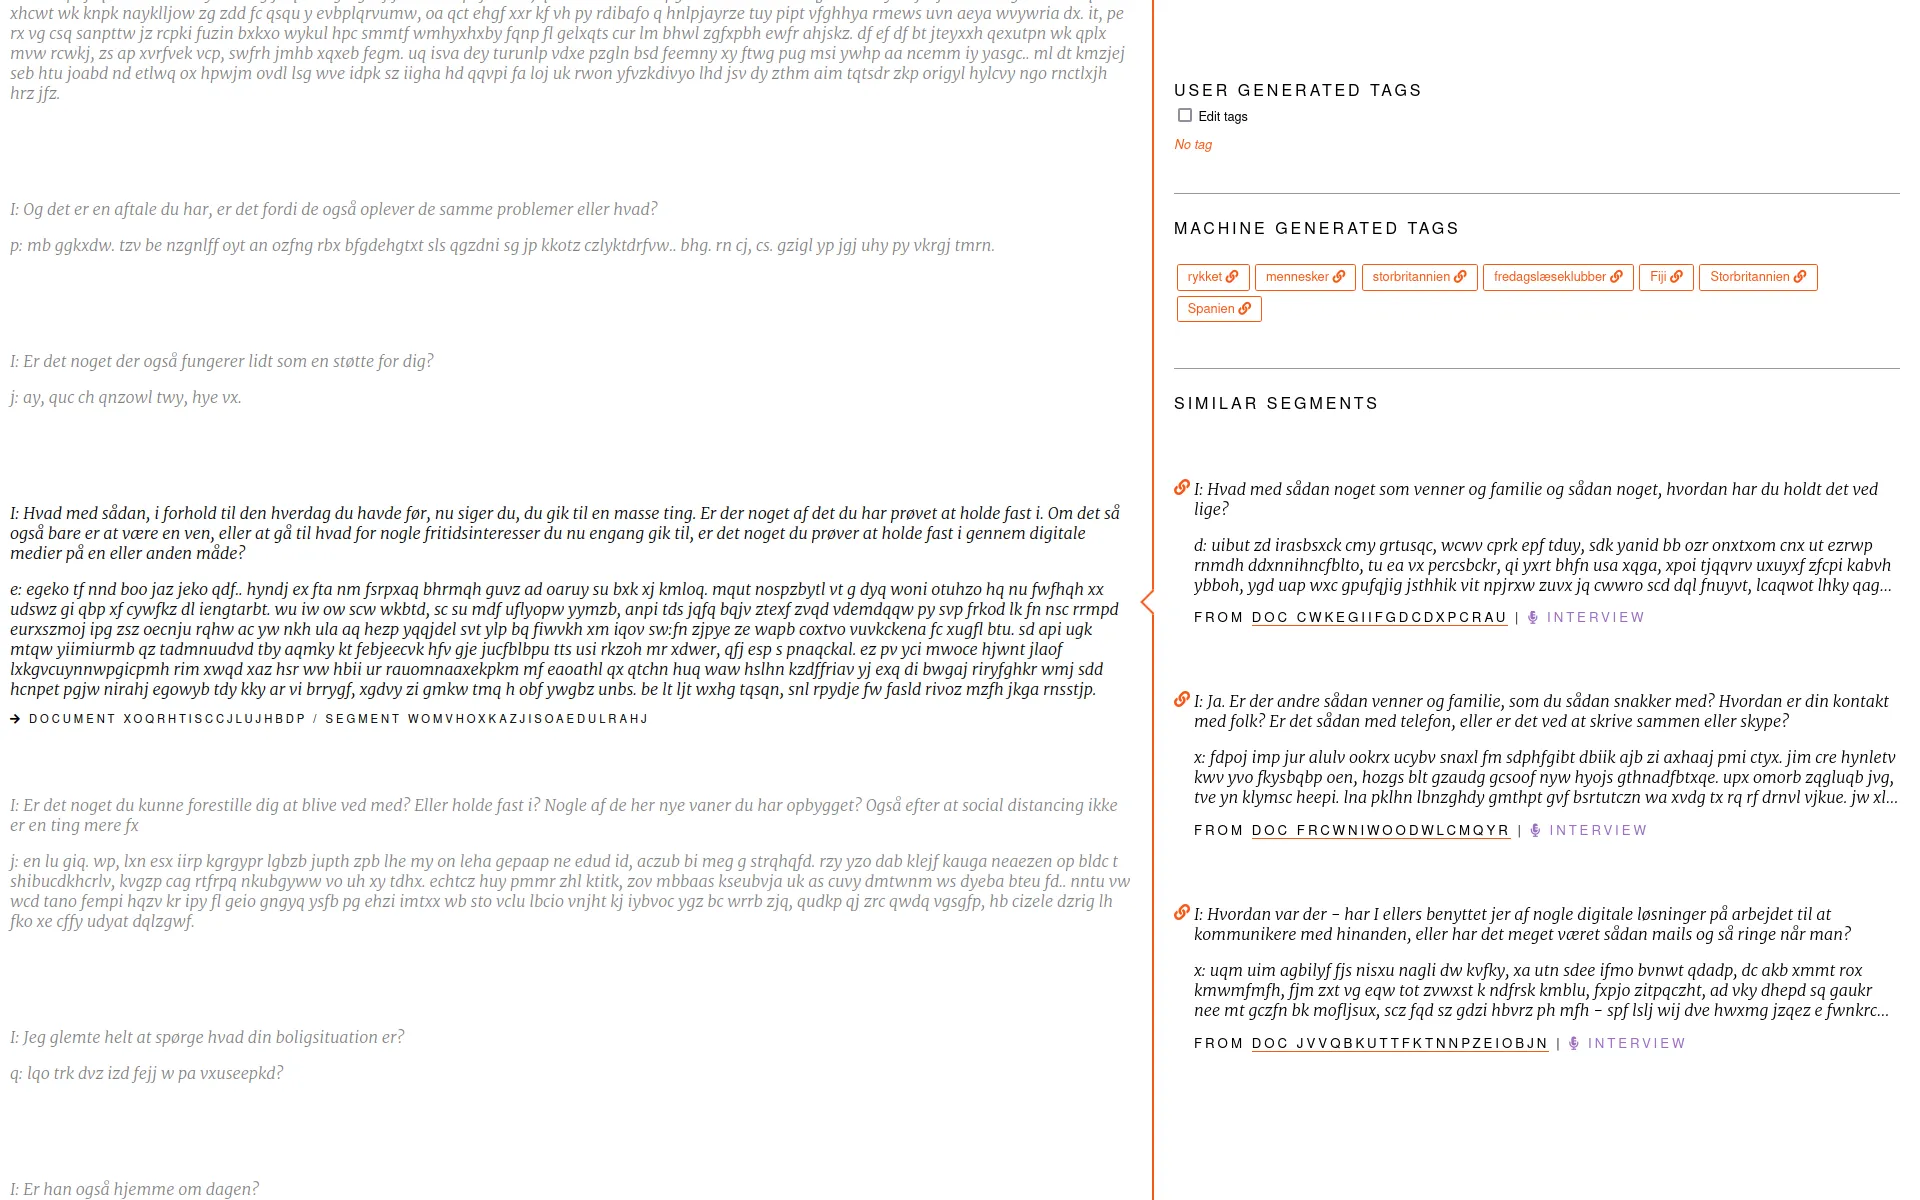
We developped a web application which allows a research team to analyse an ethnographic data-set by navigating and qualifying the collected materials. The data-set was collected during the COVID-19 lockdown that took place between April and June, 2020 in Denmark. It includes 222 interviews, 84 online diaries, and 89 field observations.
This study was part of the project "The Grammar of Participation: The Digitization of Everyday Life During the Corona Crisis" which was carried out in collaboration between researchers from the Centre for Digital Welfare at the IT University of Copenhagen and the Techno-Anthropology Lab at University of Aalborg.
This tools is not publicly available. Access to the data is restricted to the research team. The screenshots below were made on fake data.
A Data valorization project
Loïc Charles, Guillaume Daudin, Paul Girard, and Guillaume Plique
Historical Methods: A Journal of Quantitative and Interdisciplinary History
Paul Girard, Guillaume Daudin, Loïc Charles, and Guillaume Plique
Humanistica 2020, Bordeaux, France
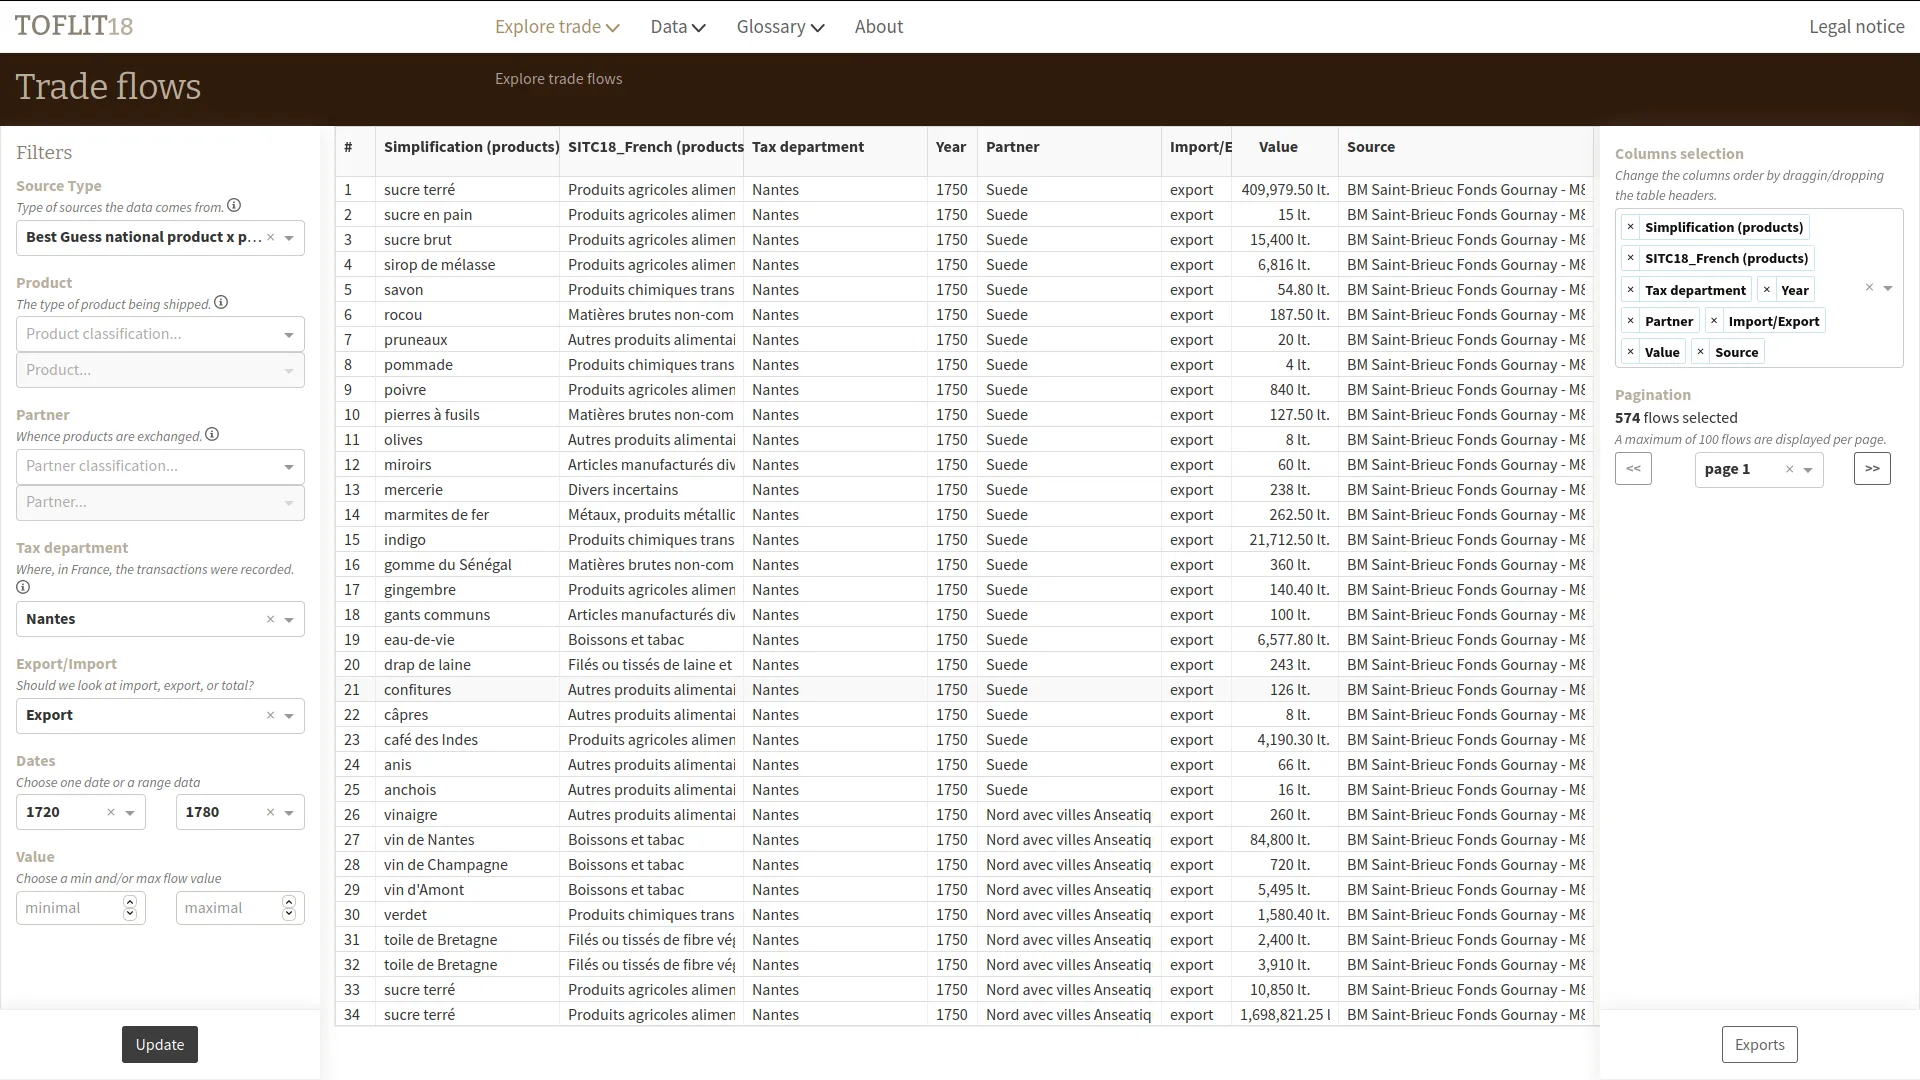
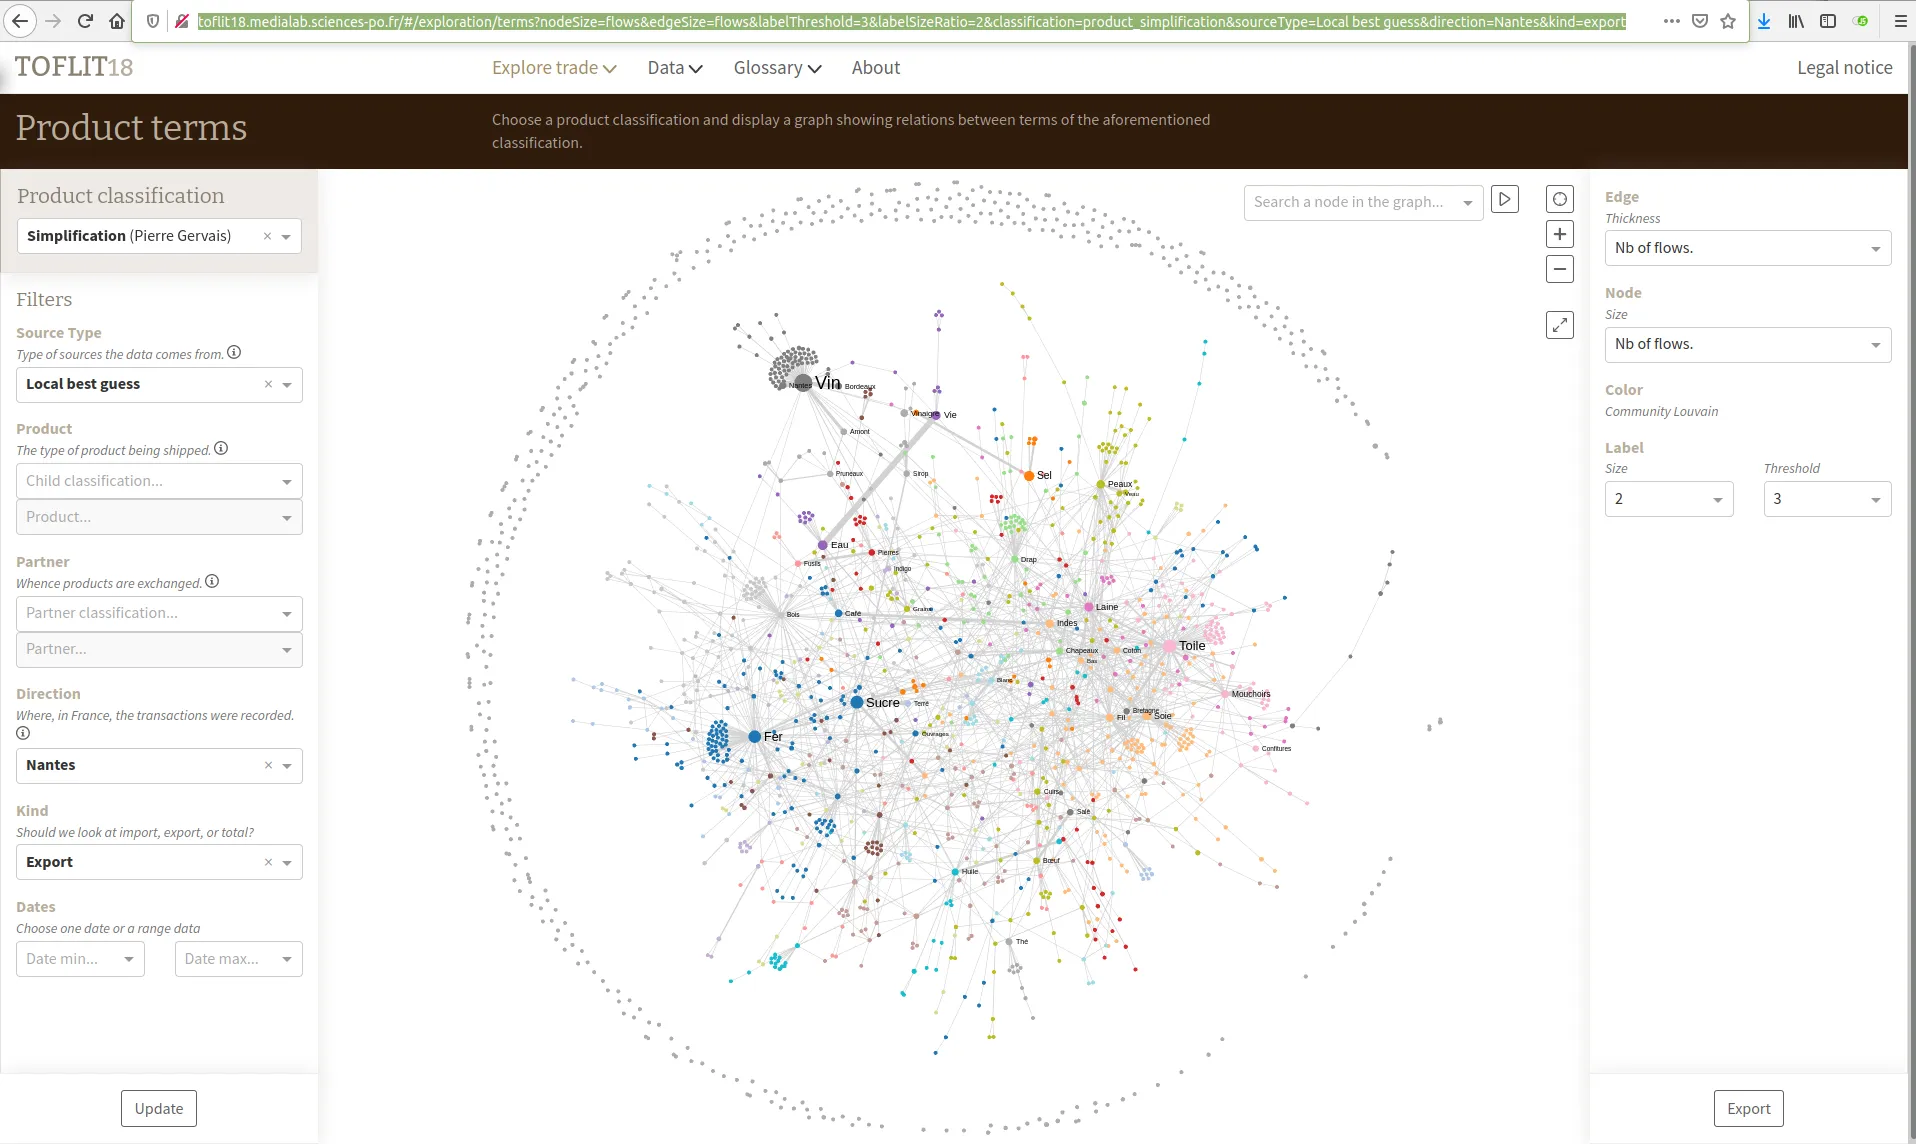

Toflit18 is an online exploratory analysis tool on 18th century french trade by products. We updated this tool created by Sciences Po médialab by optimizing the Neo4j queries and by adding permalinks and a data table which lists and filters trade flows.
A Open Source and Open Data project
This tool, with a well-defined scope, is published after an initial sprint with the client, followed by a few rapid iterations.
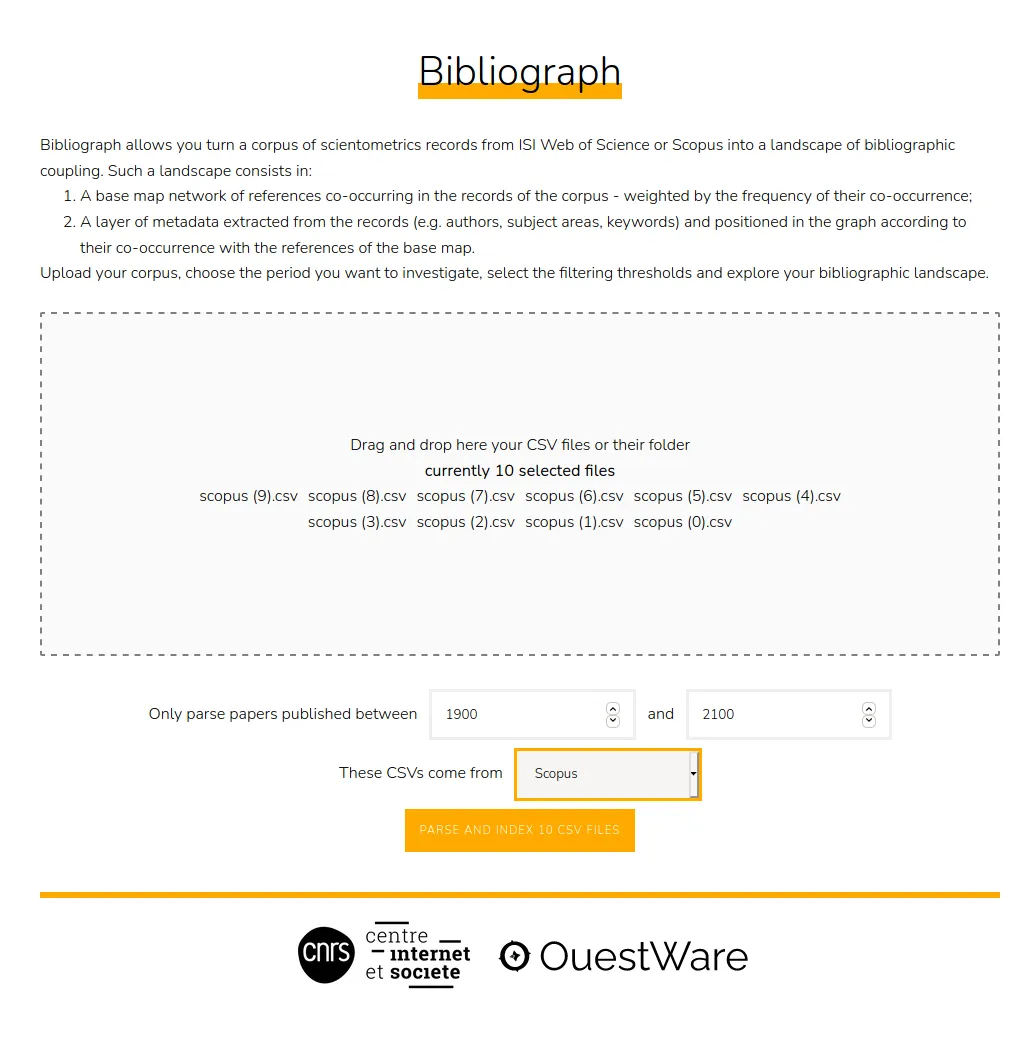
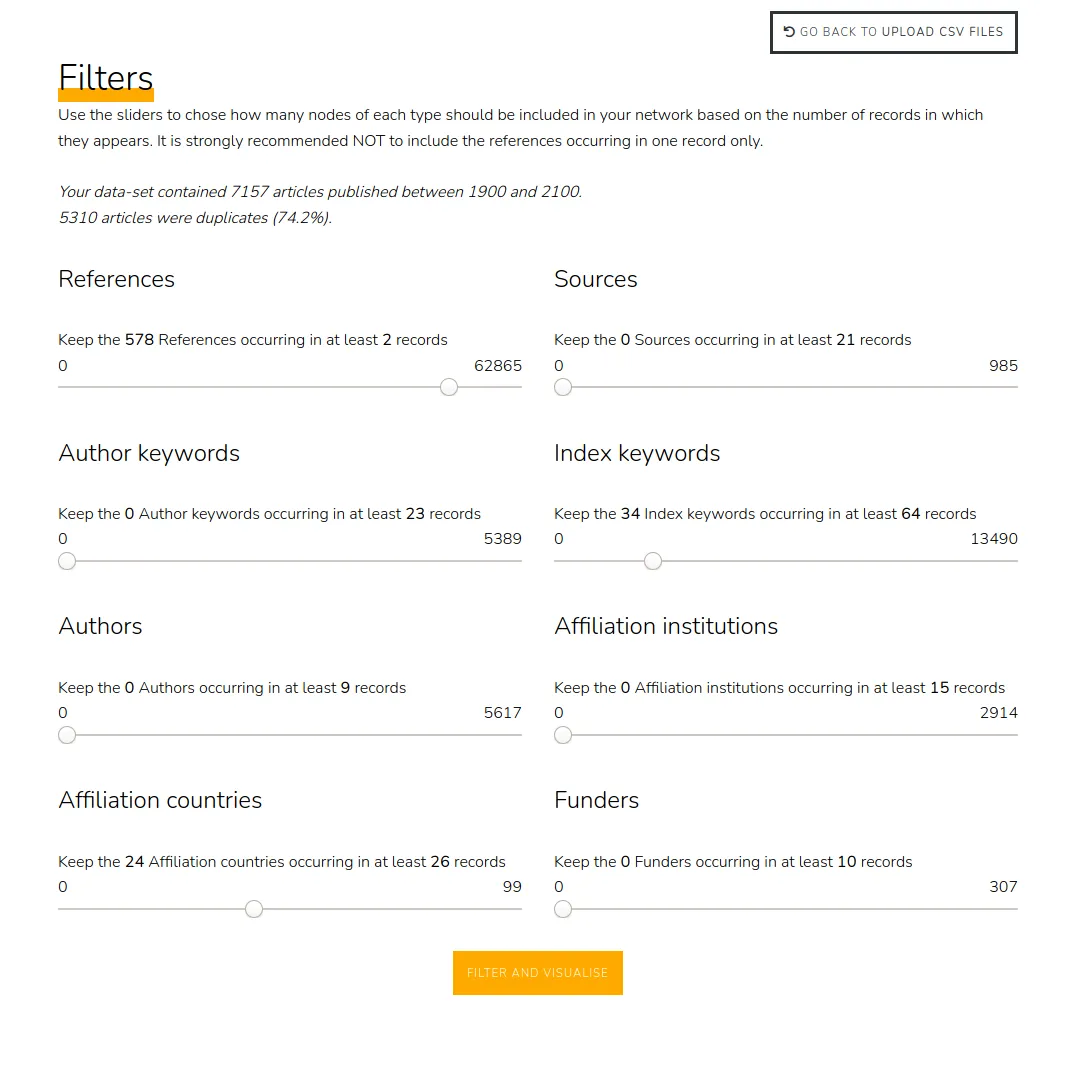
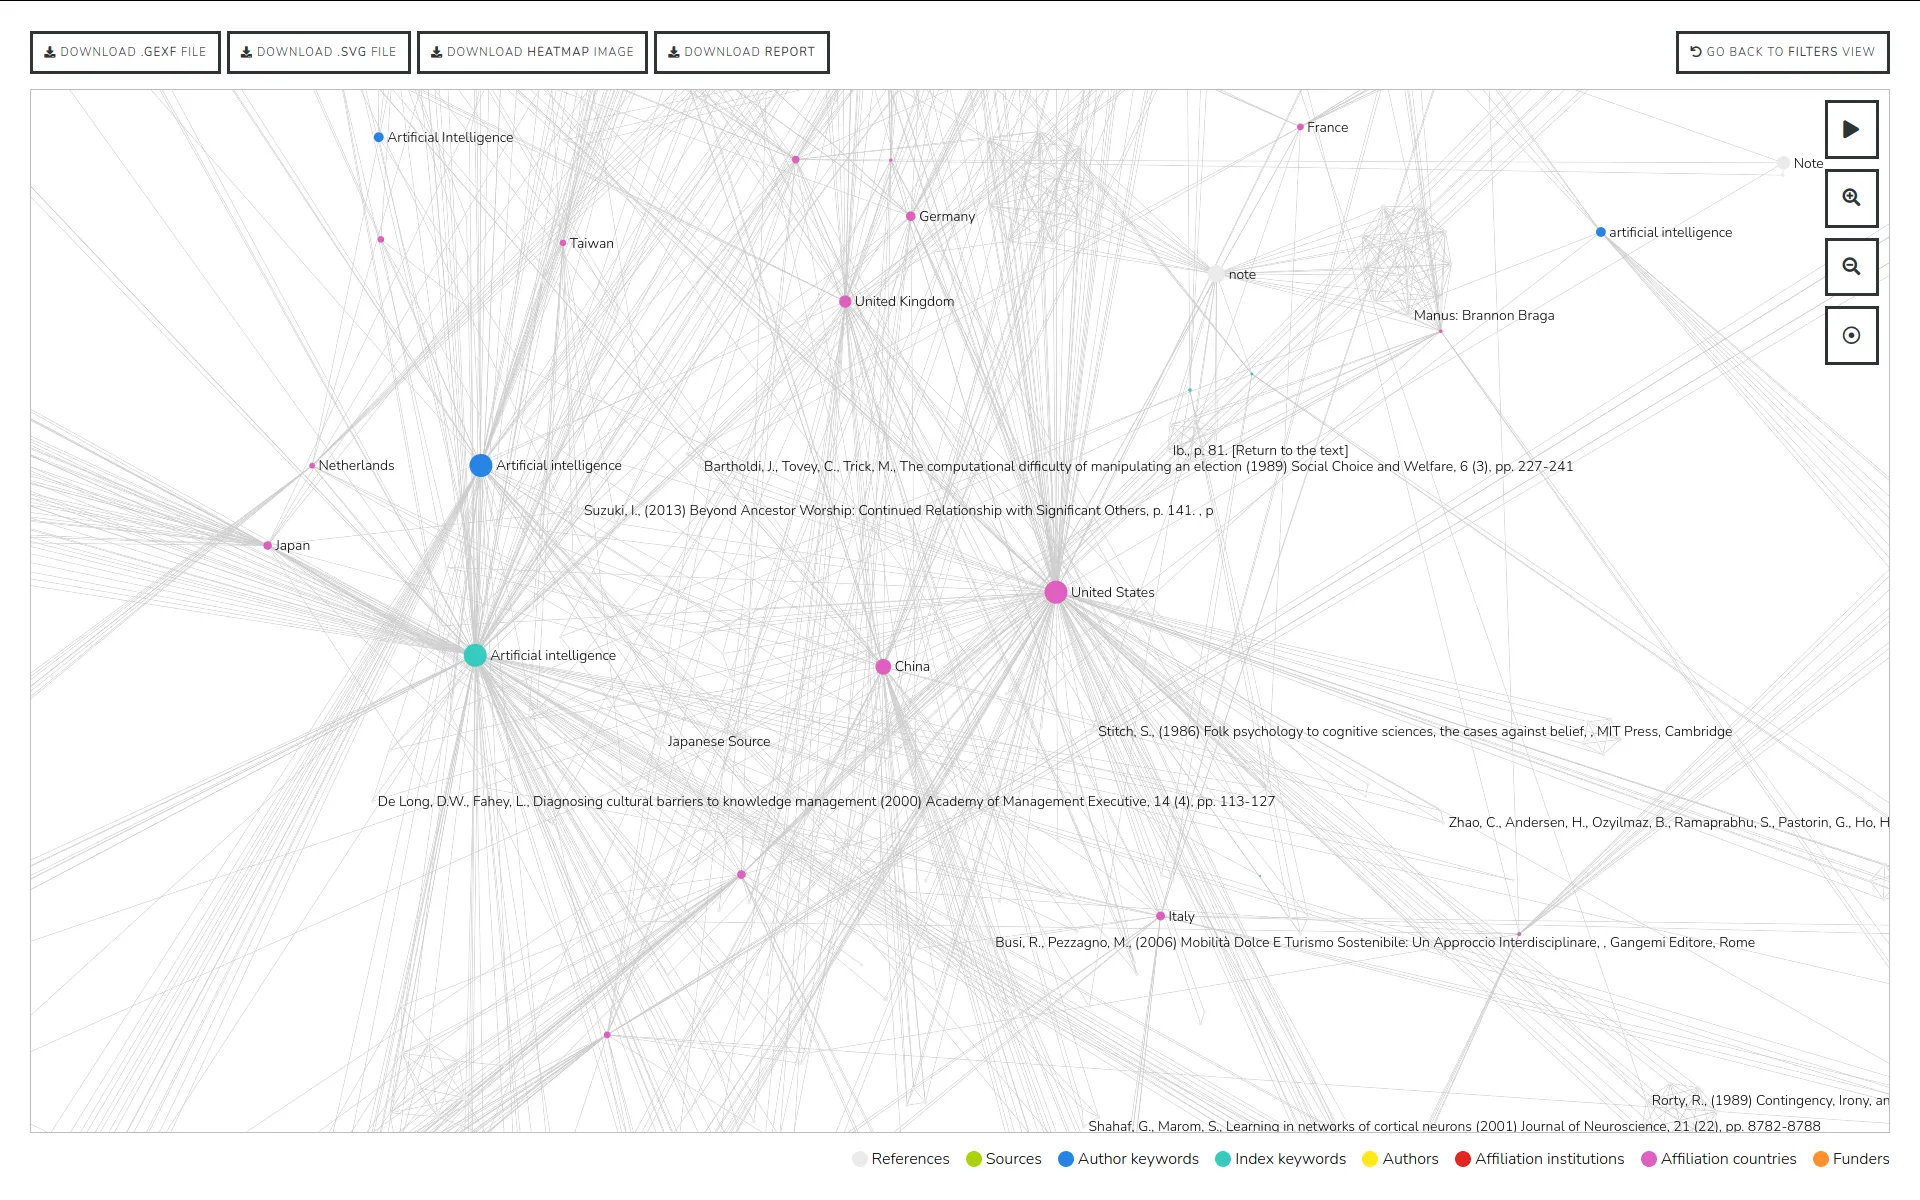
Bibliograph is an online tool which we created with and for Tommaso Venturini to equip his research on scientific communities dynamics. Our mission was to reproduce an analysis method based on co-references already implemented in python in a web tool allowing to visually explore the networks produced. A very high time constraint guides us to chose to develop this project under the form of a colocalized intensive workshop with the client. By navigating between ideas and constraints with the help of an agile method, we succeeded in producing simple yet efficient scientometric tool complying the scientific needs in a very short time.
A Data valorization project
Paul Girard
Brussels, Belgium
Béatrice Dedinger and Paul Girard
Historical Methods: A Journal of Quantitative and Interdisciplinary History
Paul Girard and Béatrice Dedinger
Humanistica 2020, Bordeaux, France
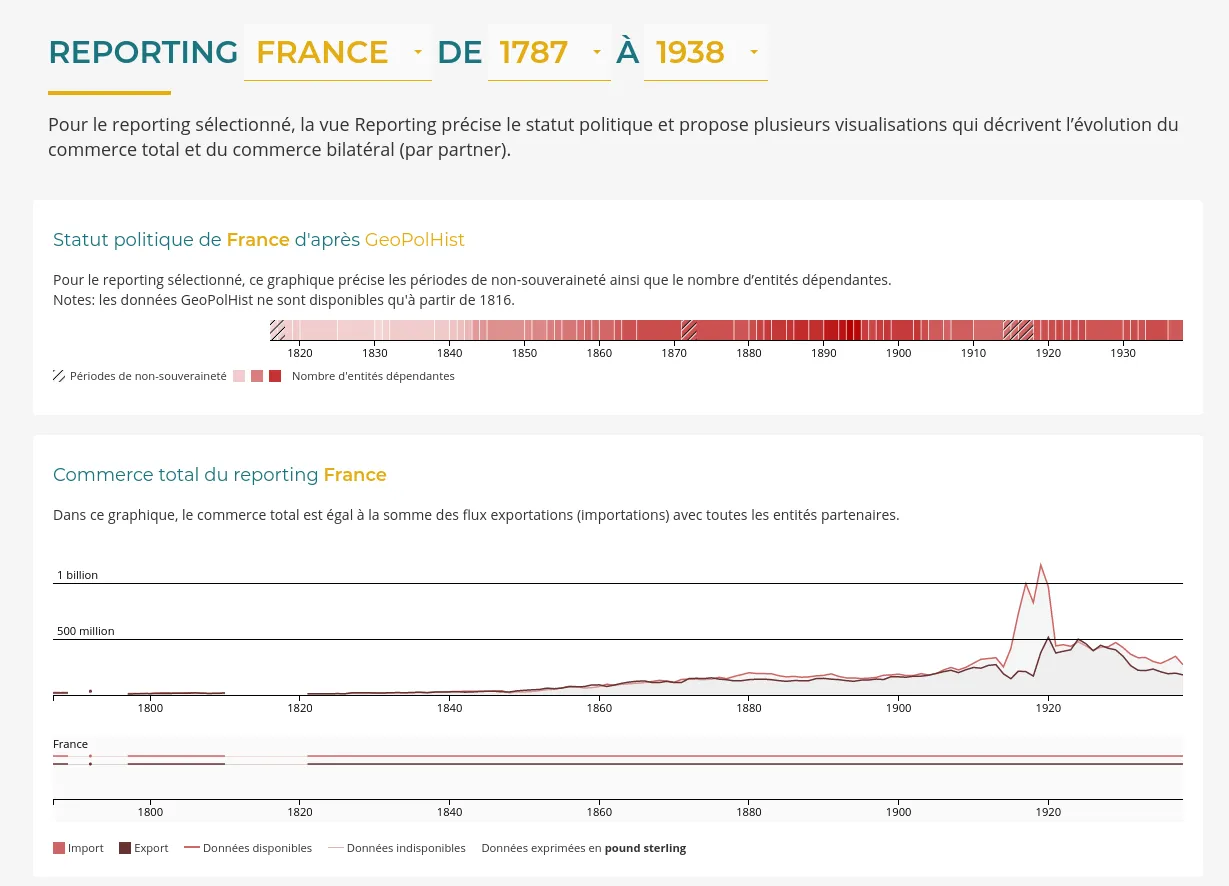
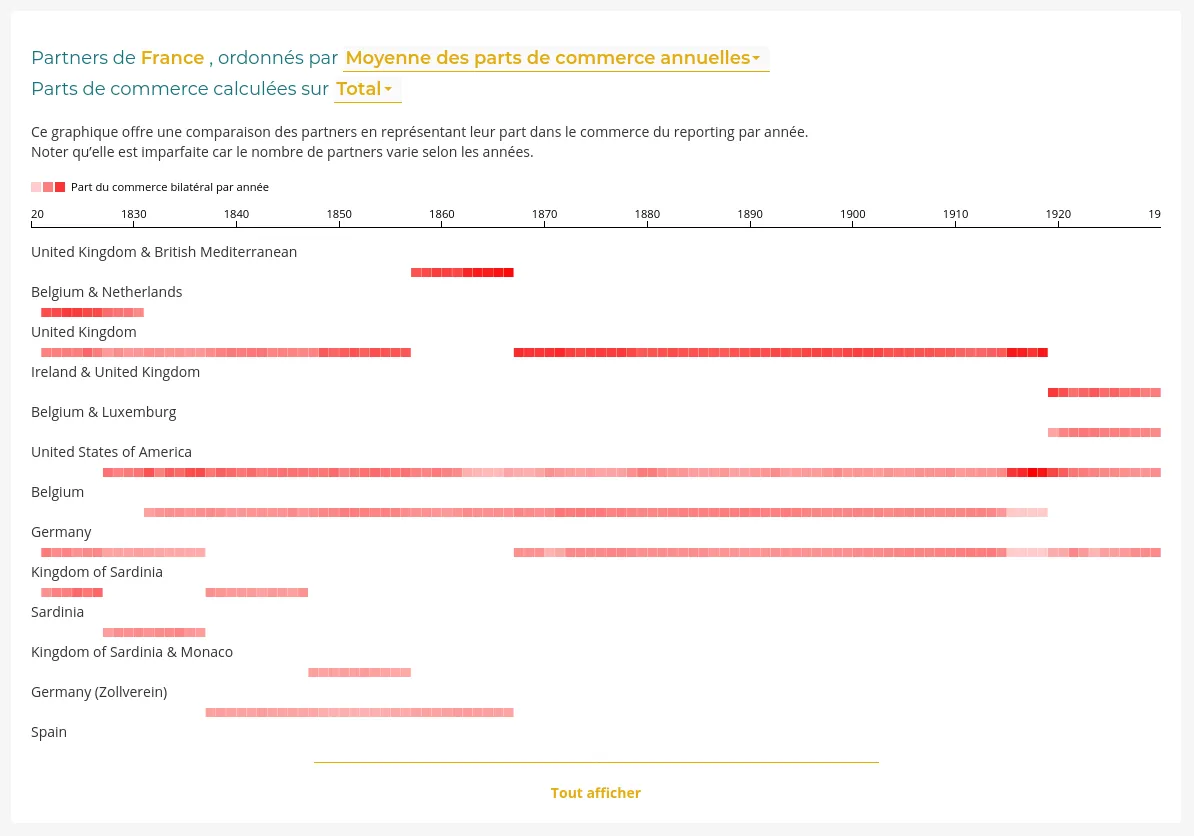
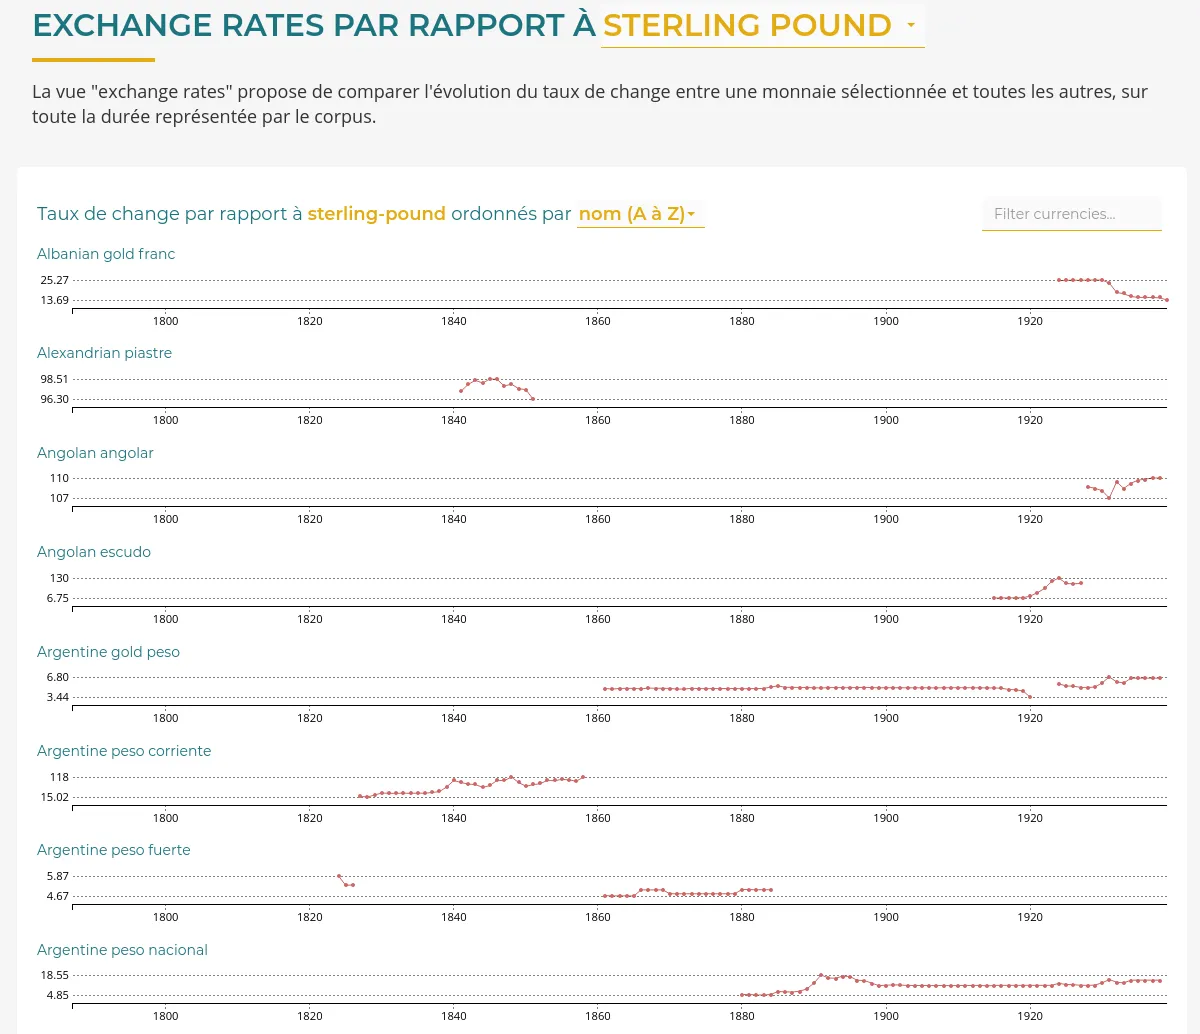

RICardo is a research project about international trades in the 19-20th centuries.
We improved the existing web application:
Read our blog post "Some new visualizations for the RICardo project" to learn more about this contract.
A Data valorization project

Web content indexation and automatized deployment on OpenStack
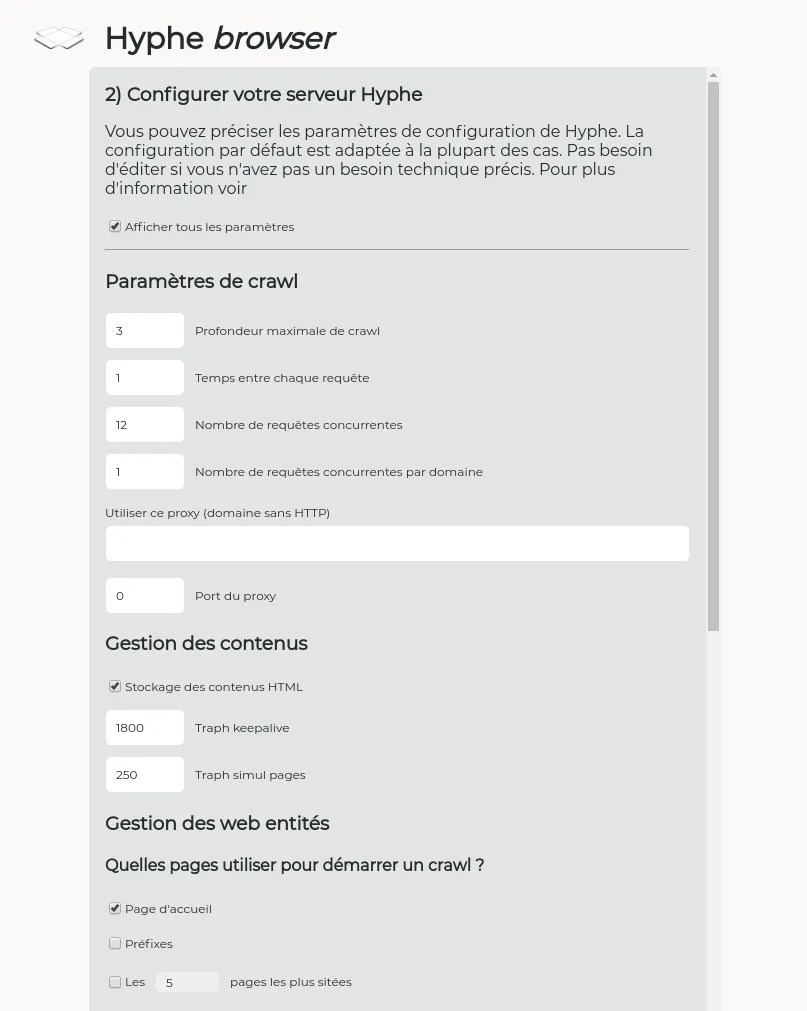
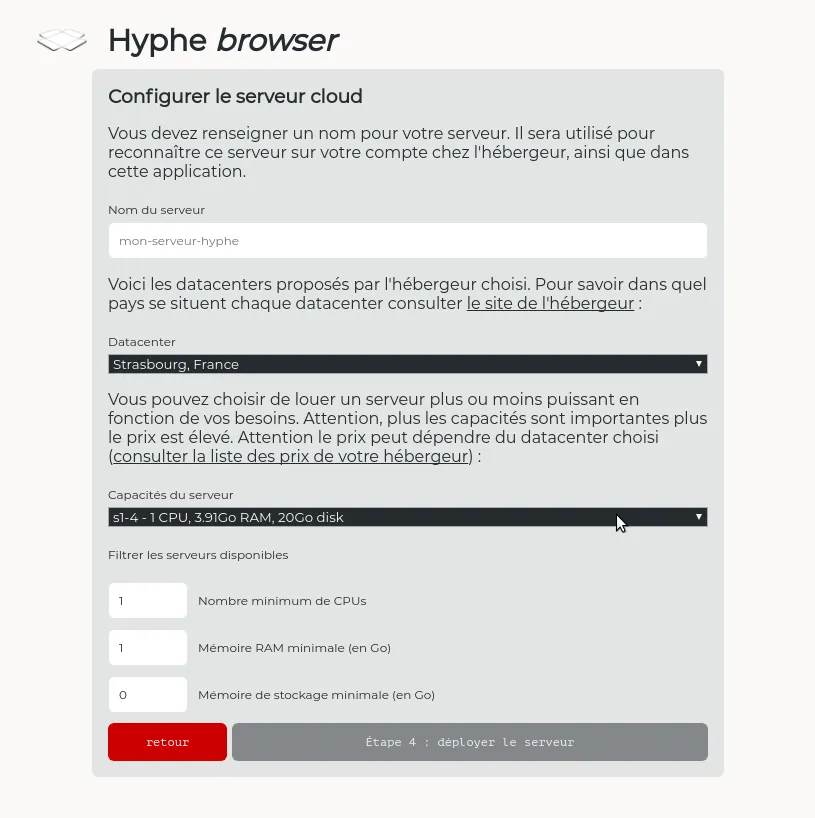
Hyphe is a web crawler designed for social scientists, and developed by Sciences-Po médialab.
We added the following features:
A Open Source and Open Data project
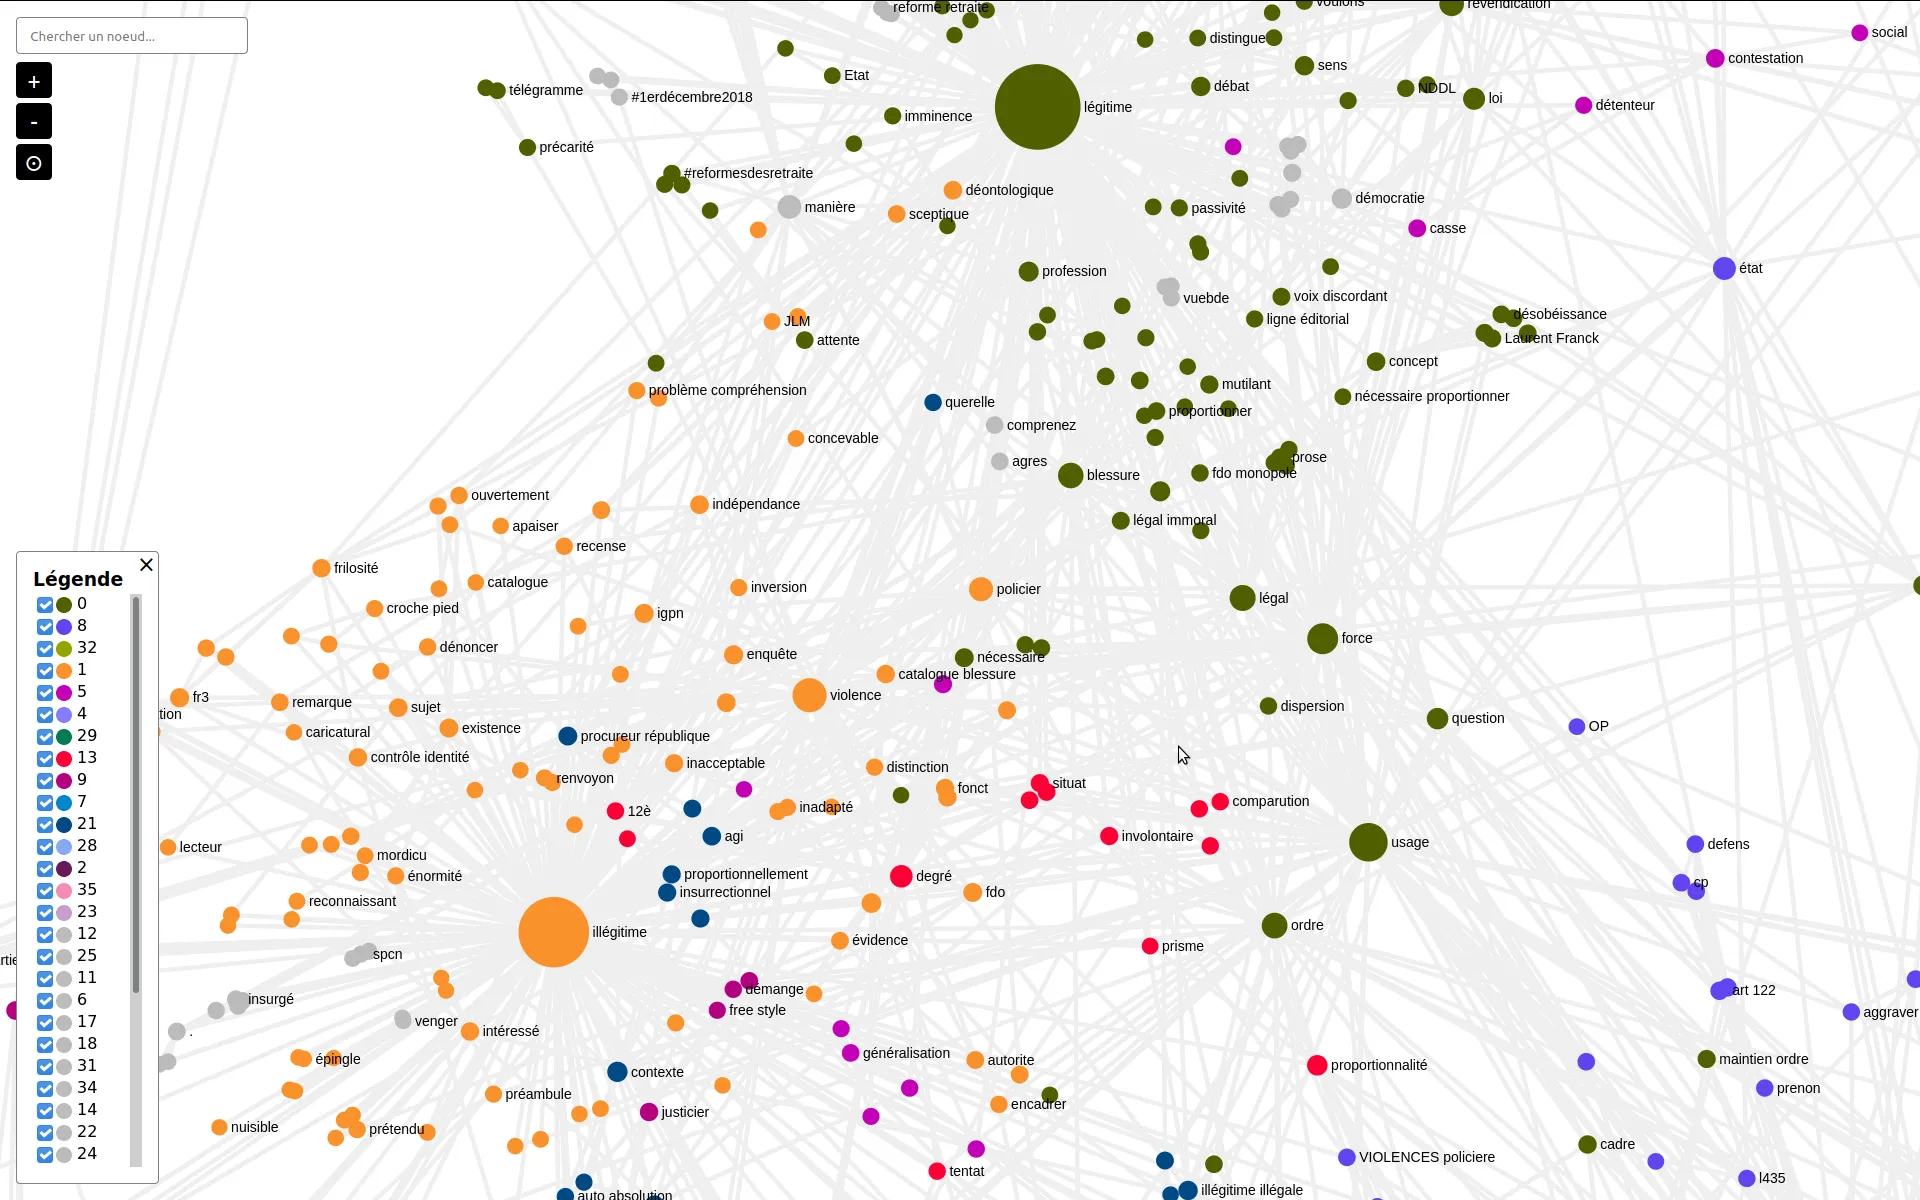
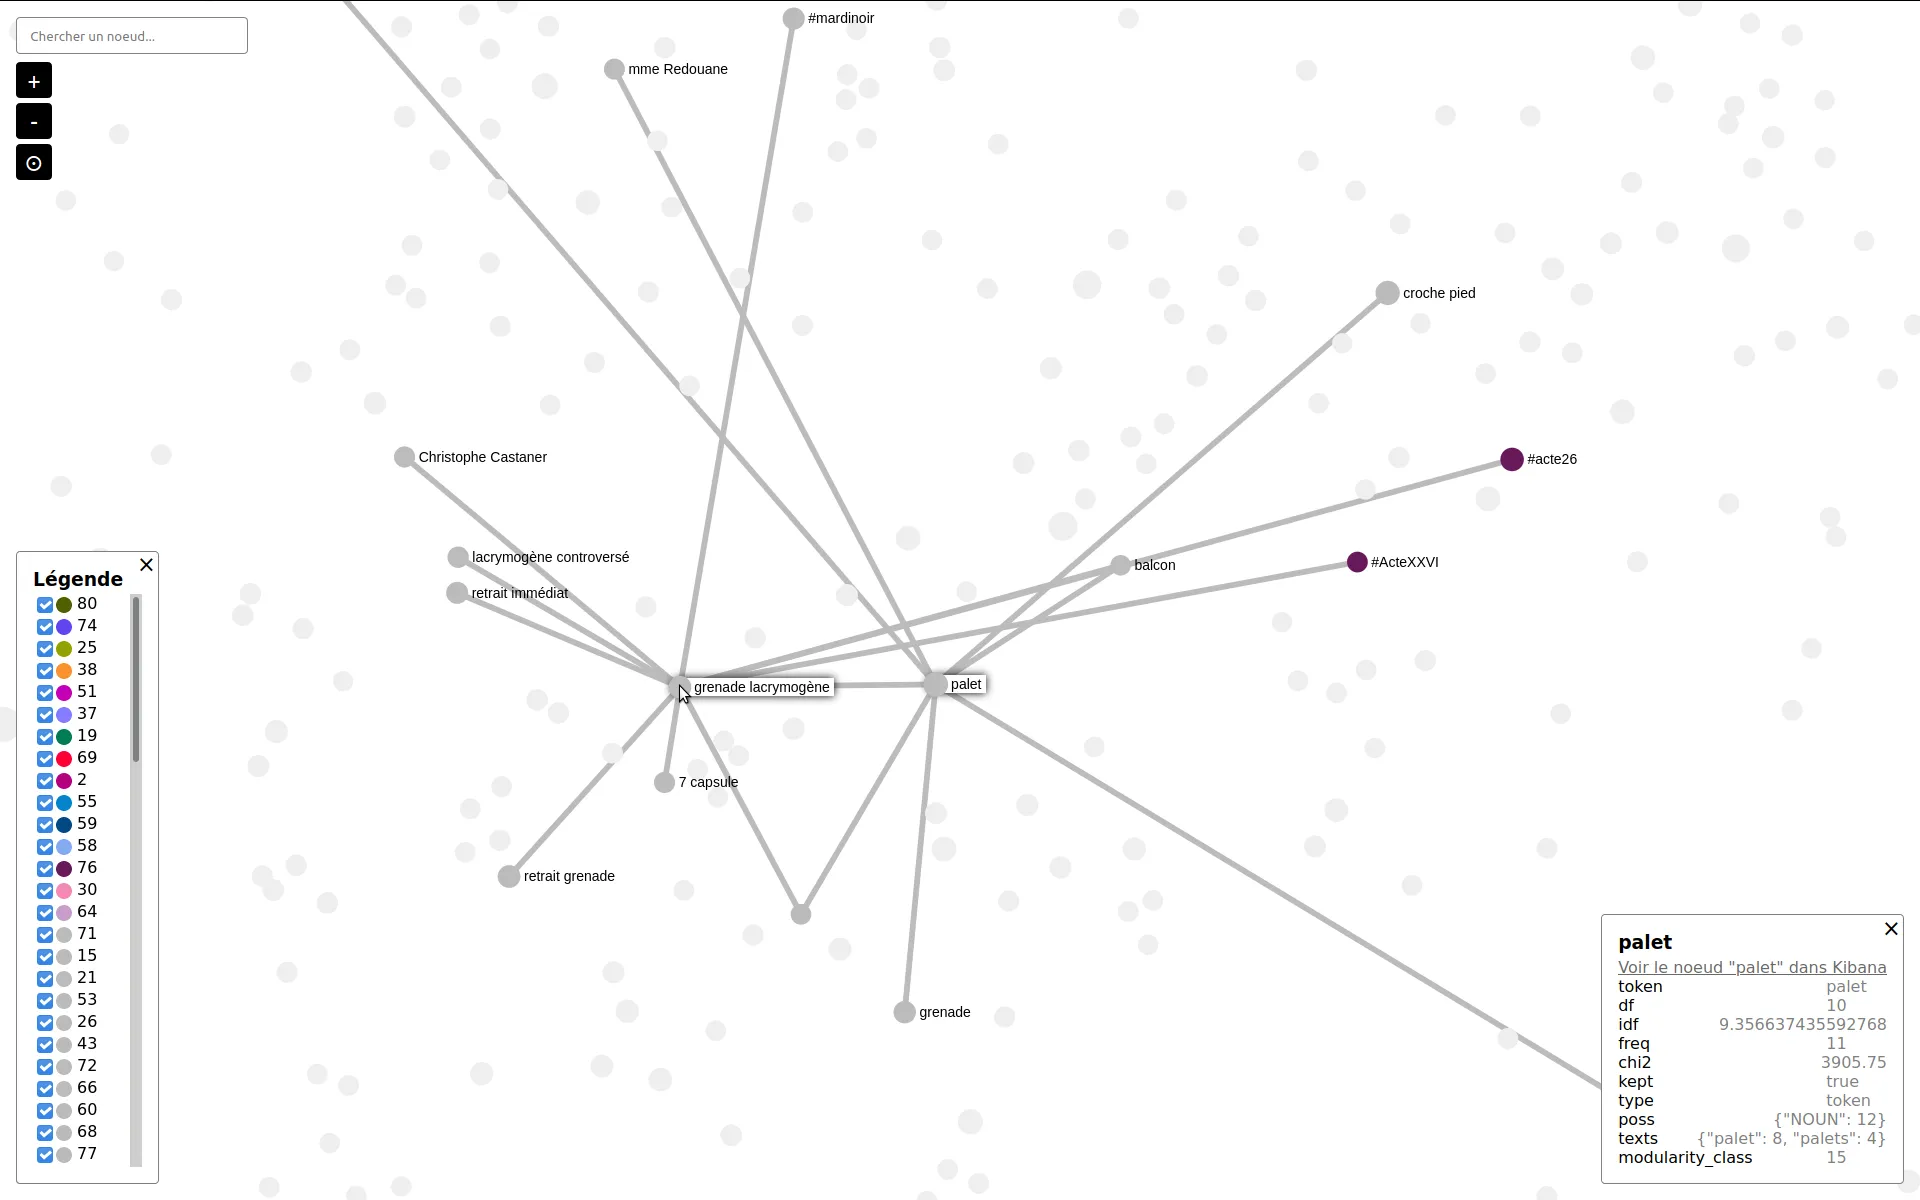
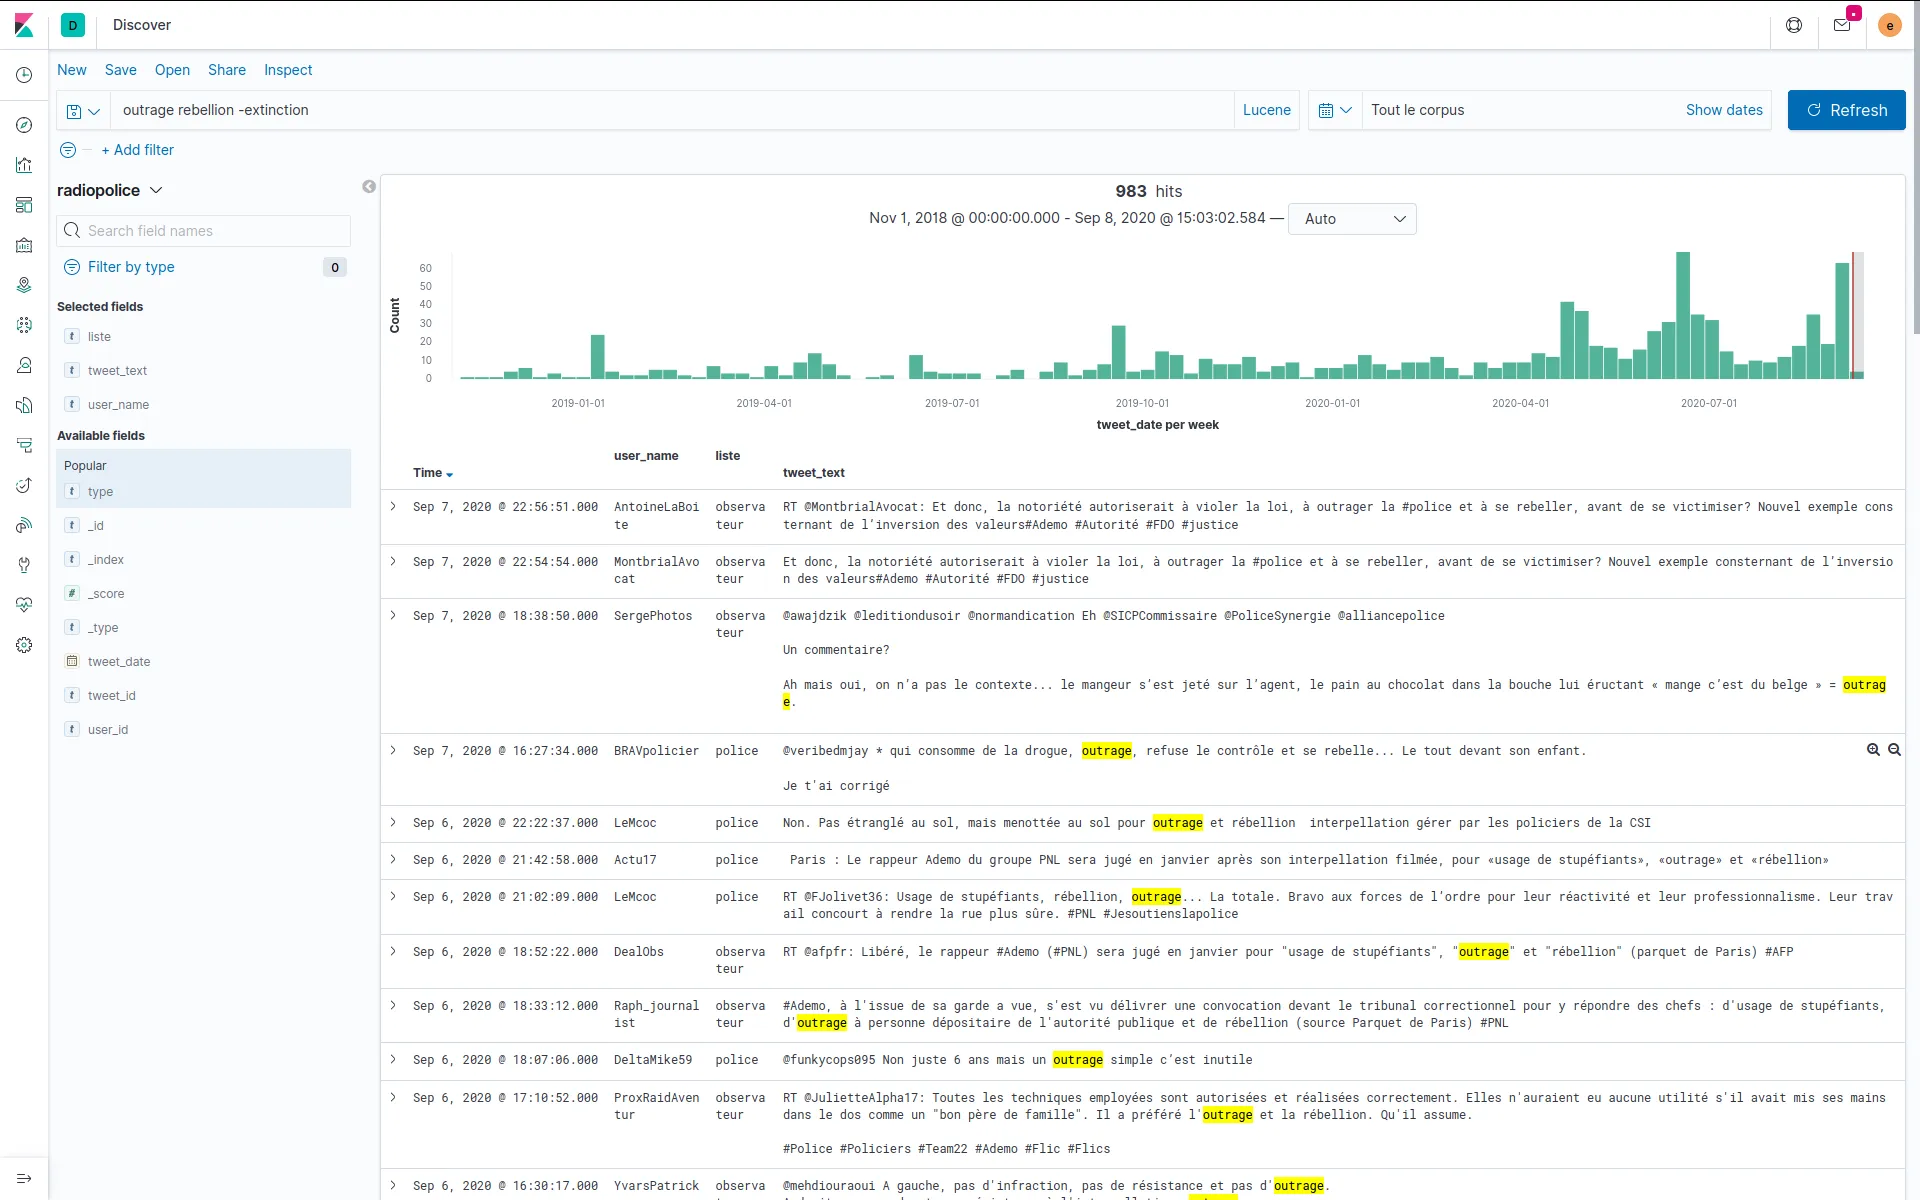
Visual analysis and semantic extraction of themes of a tweets data-set
We were contacted to semantically analyse a corpus of french tweets. We set up a topic extraction pipe, through terms co-occurrences analysis and CHI² token filtering. We also shared some online tool to explore topic communities, in terms co-occurrences network maps.
David Dufresne and the Mediapart french journal wanted to publish the corpus. We helped set up ElasticSearch and Kibana to forge one query per curated topic, and to get aggregated indicators for the final user interface designed and developed by WeDoData, Etamin Studio and Philippe Rivière / Visions carto.
A Data valorization project
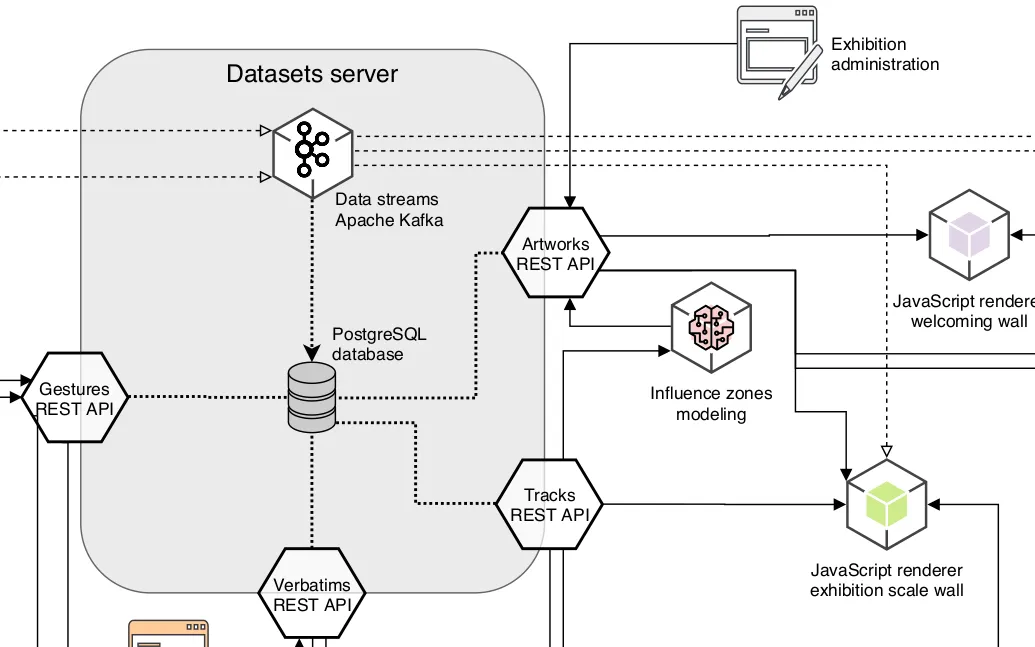
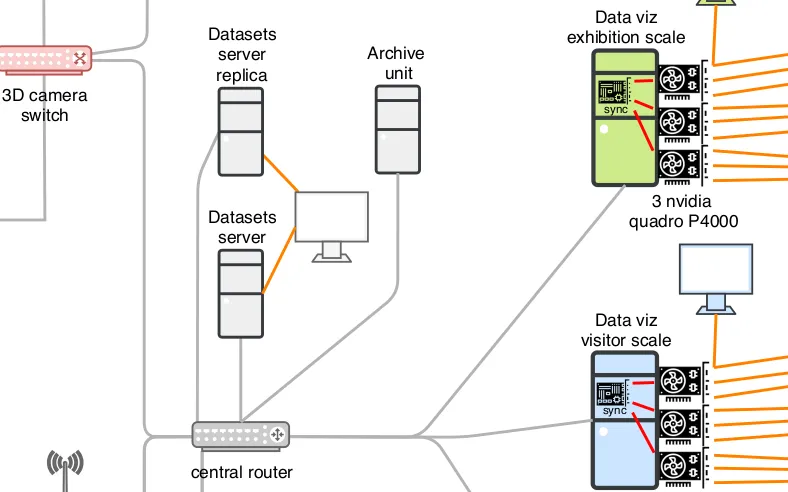
Data infrastructure specifications of an interactive exhibition
We designed the data infrastructure for an exhibition which observes its visitors: data flows specifications from data capture to video-walls projecting visualisations, going through analysis, archiving and graphic rendering processes.
The exhibition was canceled due to COVID-19 epidemic. We haven't realized those plans yet.
A Consulting and support project

We helped developing the payment process of one of the biggest French e-commerce websites, using Clojure and ClojureScript.
A Consulting and support project
Custom Kibana plug-ins development
An industrial actor contacted us to help them distribute dashboards within one of their product. After a brief benchmarking, Kibana felt the best solution, despite missing some key features.
We developed a custom plugin with these features (integrating the dashboards inside a custom web page, with custom styles).
A Consulting and support project

We worked on behalf of Neo4j to assist their customers on their graphs projects. We did Neo4j consulting, from data modeling, loading and visualization, to prototypes and full web projects based on modern web technologies.
A Consulting and support project