Gephi Lite v0.6 Release
As it has become somewhat of a tradition, we dedicated a week of our time to Gephi Lite just before heading to FOSDEM. And this sprint was particularly productive! Our initial goal was to focus on maintenance, backlog reduction and publish results of recent experimentations. Here are the main outputs:
- Topological filters, in addition to the existing attribute-based filters for nodes and edges.
- A new JSON file format to save a network along with its context in Gephi Lite (filters, appearance, etc.).
- A TypeScript library to control Gephi Lite from other web applications, based on the Broadcast Channel API.
- A new method to reveal Louvain clustering uncertainty.
New Features
Topological Filters
Gephi Lite’s filters were designed to be simpler and lighter than Gephi’s logical tree system. Unfortunately, some very common use cases in visual network analysis were not possible until now:
- Filtering only the main connected component
- Hiding leaf nodes and, more generally, chains ending in leaf nodes
- Filtering only the neighborhood of a given node
We had already planned topological filters for Gephi Lite, now they are fully implemented!
- The connected components filter keeps only the N largest connected components.
- The k-core filter retains nodes with a degree greater than k. For example, the 2-core of a graph is the graph minus the chains ending in leaves.
- Finally, the ego network filter keeps only the subgraph within a distance of N from a given node.
The dynamic degree attribute
So far node and edge attributes were static. Attributes’ values are stored in the data graph and only updated when users edit it manually or through the statistics panel. However, some attributes such as node degree are in network statistics a topological concept. A node Degree is the number of its edges. If edges change nodes degrees should too.
Till version 0.6 node degree was a standard node attribute one could create/update through the degree statistic. If the network topology was to change, those degree values became somewhat outdated. Getting up-to-date degree values after filtering or edge deletion used to require to recompute degree statistic.
To solve this issue we added dynamic attributes to Gephi Lite. Dynamic attributes are attributes whose value is defined by a function taking the item identifier and the current network topology as parameters. A new reactive mechanism ensures those functions to be triggered when needed, i.e. when the current network topology changes.
For now we only implemented the node degree as a dynamic attribute. But the architecture is now ready to welcome more if needed.
Please note that only the unweighted degree has been ported as a dynamic attribute. Weighted degree computation requires to chose one edge attribute as weights. Asking this to the user would have brought too much overhead complexity. We decided to put the weighted degree aside keeping it as a standard attribute for now.
New Features in the “Appearance” Panel
We added several features to the “Appearance” panel.
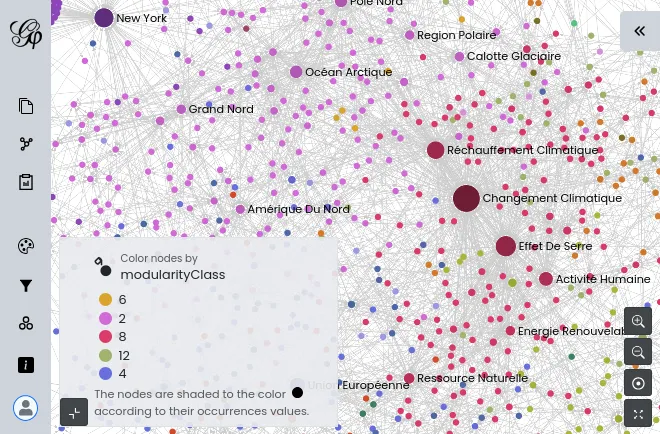
It is now possible to add a second dimension for coloring nodes and/or edges. This new feature, called “Color Shading”, allows elements to be colored as before but then interpolated towards a fixed color based on a numerical attribute.
For example, community detection using the Louvain method often determines node color. With this new feature, it can also represent a score associated with nodes.
Additionally, it is now possible to:
- Modify the depth of edges
- Truncate labels of nodes and edges that are too long
The New JSON Format
The key difference between Gephi Lite and Gephi is that Gephi Lite is primarily dynamic. In Gephi Lite, you configure filters and graphical variables, and it determines which nodes and edges to display and how to style them. This approach allows Gephi Lite to explain the graph with a legend. However, this contextual information (filters and graphical settings) was only available within Gephi Lite and couldn’t be shared.
To address this, we defined a new JSON format that contains all graph data: topology, rendering data, node and edge metadata, and even graph appearance and filter settings.
This new format allows users to save a graph and reload it while preserving its appearance and filters. Since Gephi Lite can generate permalinks for specific graphs, it enables seamless integration, such as embedding an iframe in this page with Gephi Lite showcasing the demo graph used in the screenshot above:
Integrating Gephi Lite into Web Applications
At OuestWare, we integrate sigma.js into many web applications. While some use cases are lightweight, some clients have a strong culture of visual network analysis and would like to have Gephi directly within their applications. Gephi Lite was already embeddable as long as the hosting application could provide an URL to a graph file. But it was not possible to imagine more complex interaction than ‘open file’ to closer integrations. We worked on that precise issue in a recent project and we dedicated some time in this iteration to finalize the first version of a mechanism to control Gephi Lite from other web pages.
Note: For this to work, Gephi Lite must be deployed on the same domain as the web application.
Here’s how it works:
- To control Gephi Lite from a webpage, you can open it in a new tab (with a
broadcastparameter) - When Gephi Lite starts with such a
broadcastparameter in the URL, it listens for messages on the corresponding Broadcast Channel - The webpage can then emit messages on the Broadcast Channel.
- Gephi Lite receives and react to the received messages.
- Gephi Lite can also emit events to warn the webpage of updates or something else (not yet implemented)
To simplify the developers’ life (including ourselves), we developed a TypeScript library @gephi/gephi-lite-broadcast that abstracts messaging into a simple API using promises.
We added the very first implementation of this mechanism in Gephi Lite to implement a “Clone the graph in a new tab” button (with appearance and filters). See next section for another use of that feature.
We are very proud of that feature which opens new doors of the use of Gephi Lite in existing web applications. Beware fresh painting! But we will quickly extend and polish things as we will for sure be part of the early adopters crowd.
Observing Uncertainty in the Louvain Method
Last December we joined the Unblackboxing Community Detection workshop, organised by Mathieu Jacomy featuring Guillaume Plique, Benjamin Ooghe-Tabanou, Andrea Benedetti and Tommaso Elli, and funded by the MASSHINE center at Aalborg University. This effort originates from the 2022 Gephi Week, where a team started working on strategies to evaluate and visualize ambiguity in Louvain community detection results.
One approach involved:
- Running Louvain N times (e.g., 50 or 100 times)
- Computing an edge co-membership score for each edge (the percentage of times both endpoints were in the same community)
- Calculating an ambiguity score for each edge
- Aggregating the average ambiguity score per node
To calculate and visualise those scores we can now use Gephi Lite as follows:
- In Gephi Lite “Statistics” panel, you’ll find a new item called “Louvain edges ambiguity”.
- This statistic computes in one shot both edges and nodes metrics described above.
- At the very bottom of this panel you’ll find a button called “Observe ambiguity visually (will open a new tab)”. Use it to open the current graph with a dedicated appearance state to reveal ambiguity :
- Graph background is dark.
- Nodes are white and their size is proportional to their average ambiguity score.
- Edges are colored by their source community, but this color is shaded by the edge ambiguity score: the more ambiguous, the whiter.
- Less ambiguous edges are displayed on top of ambiguous ones.
We’re excited to see what other opportunities will emerge from the Gephi community’s future discussions!